

Can one expect slight correction of Bitcoin (BTC) before further rise?
Even though bulls are still controlling the situation on the market, some coins have already entered a correction phase.
BTC/USD
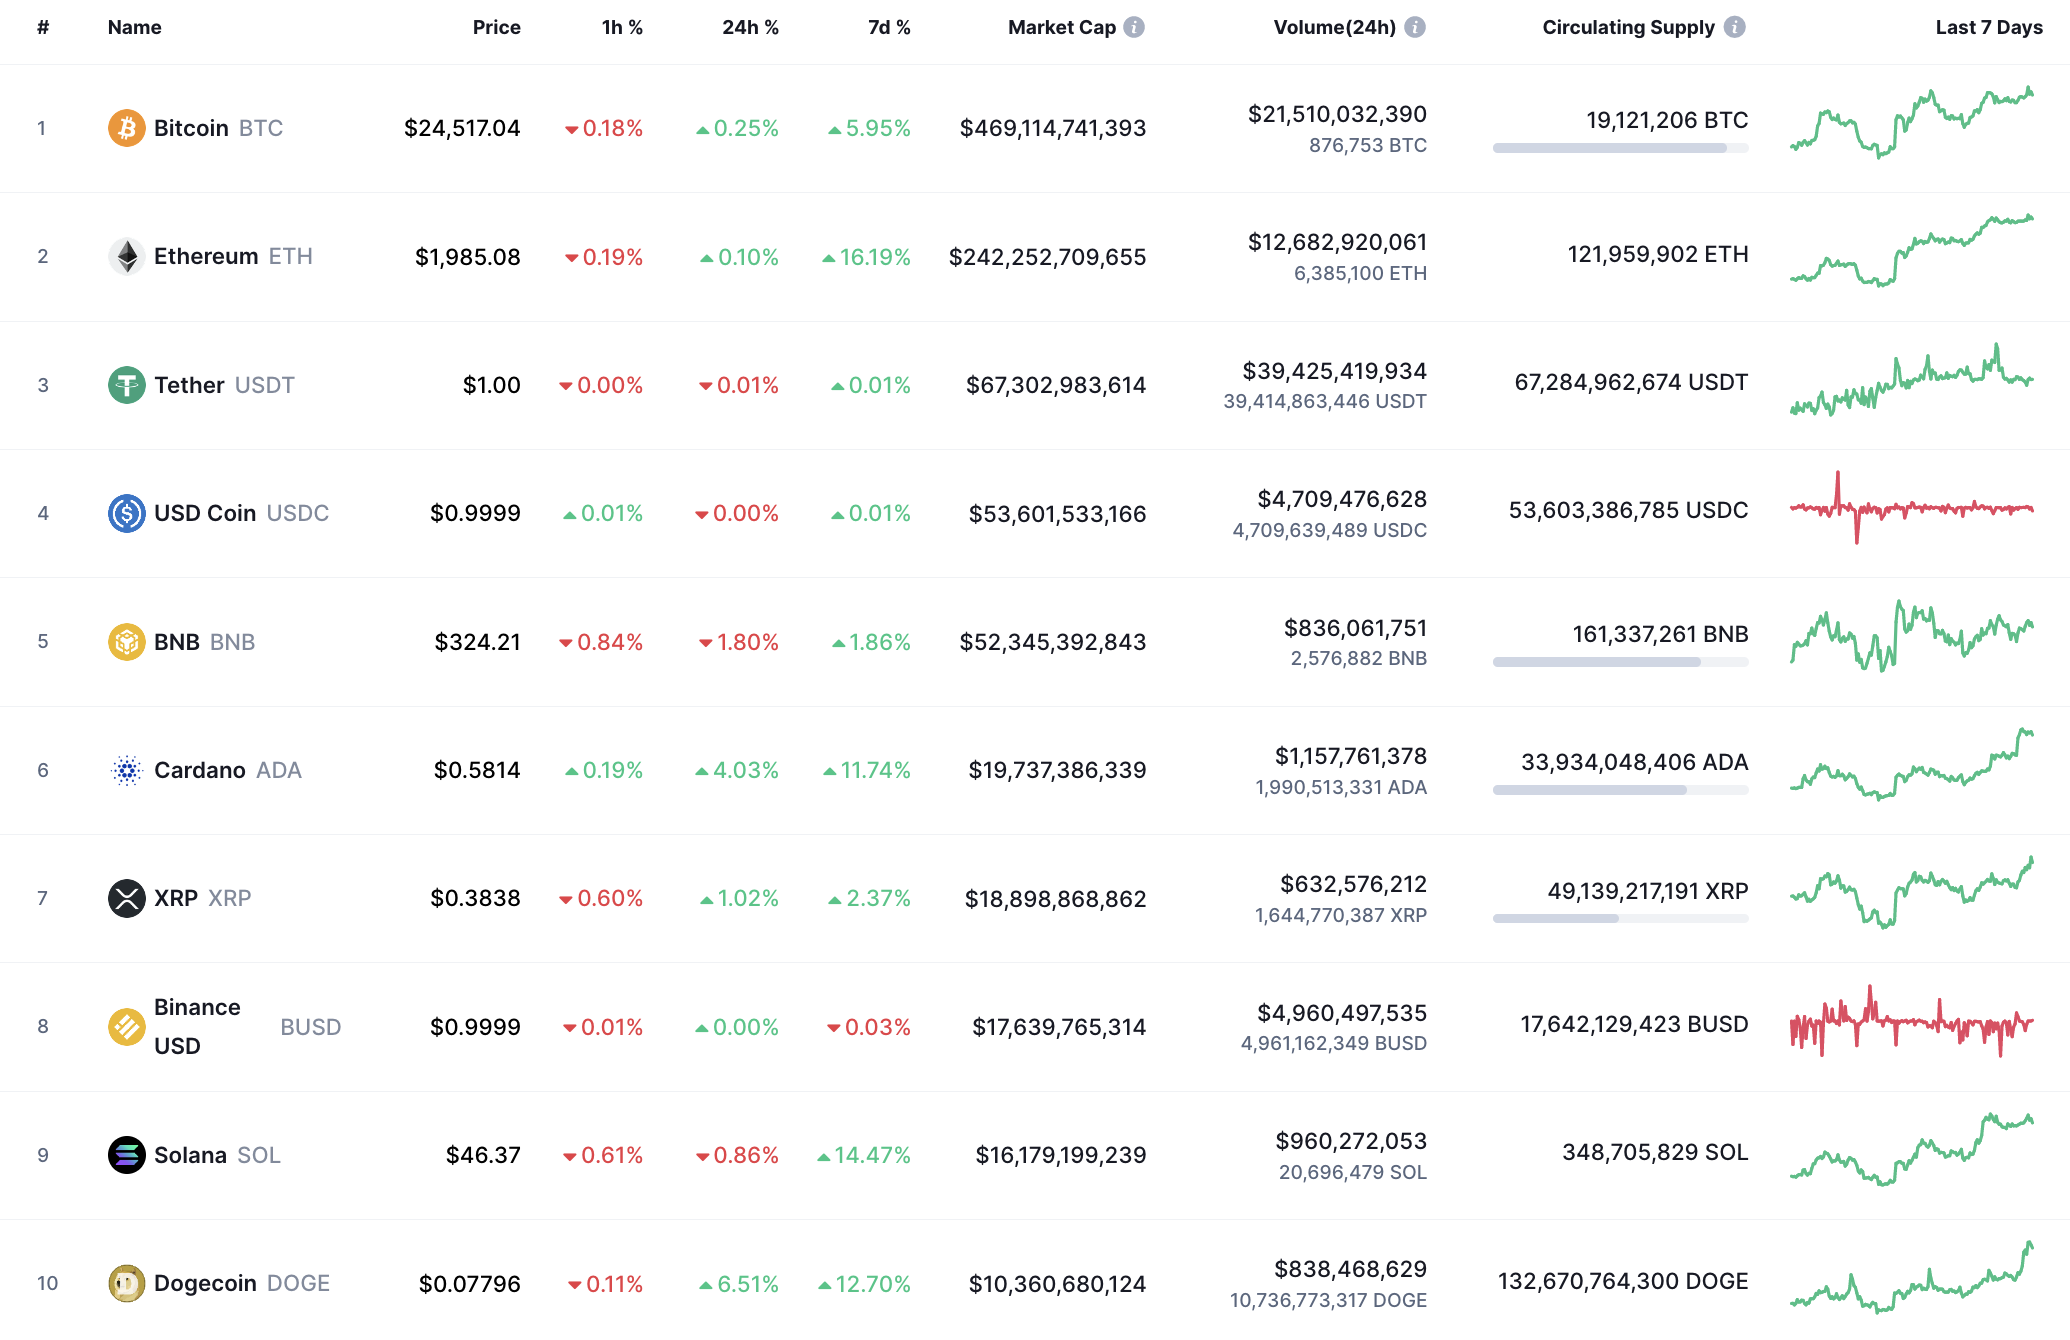
The rate of Bitcoin has seen almost no change since yesterday, while the price has risen by 5.85% over the last week.
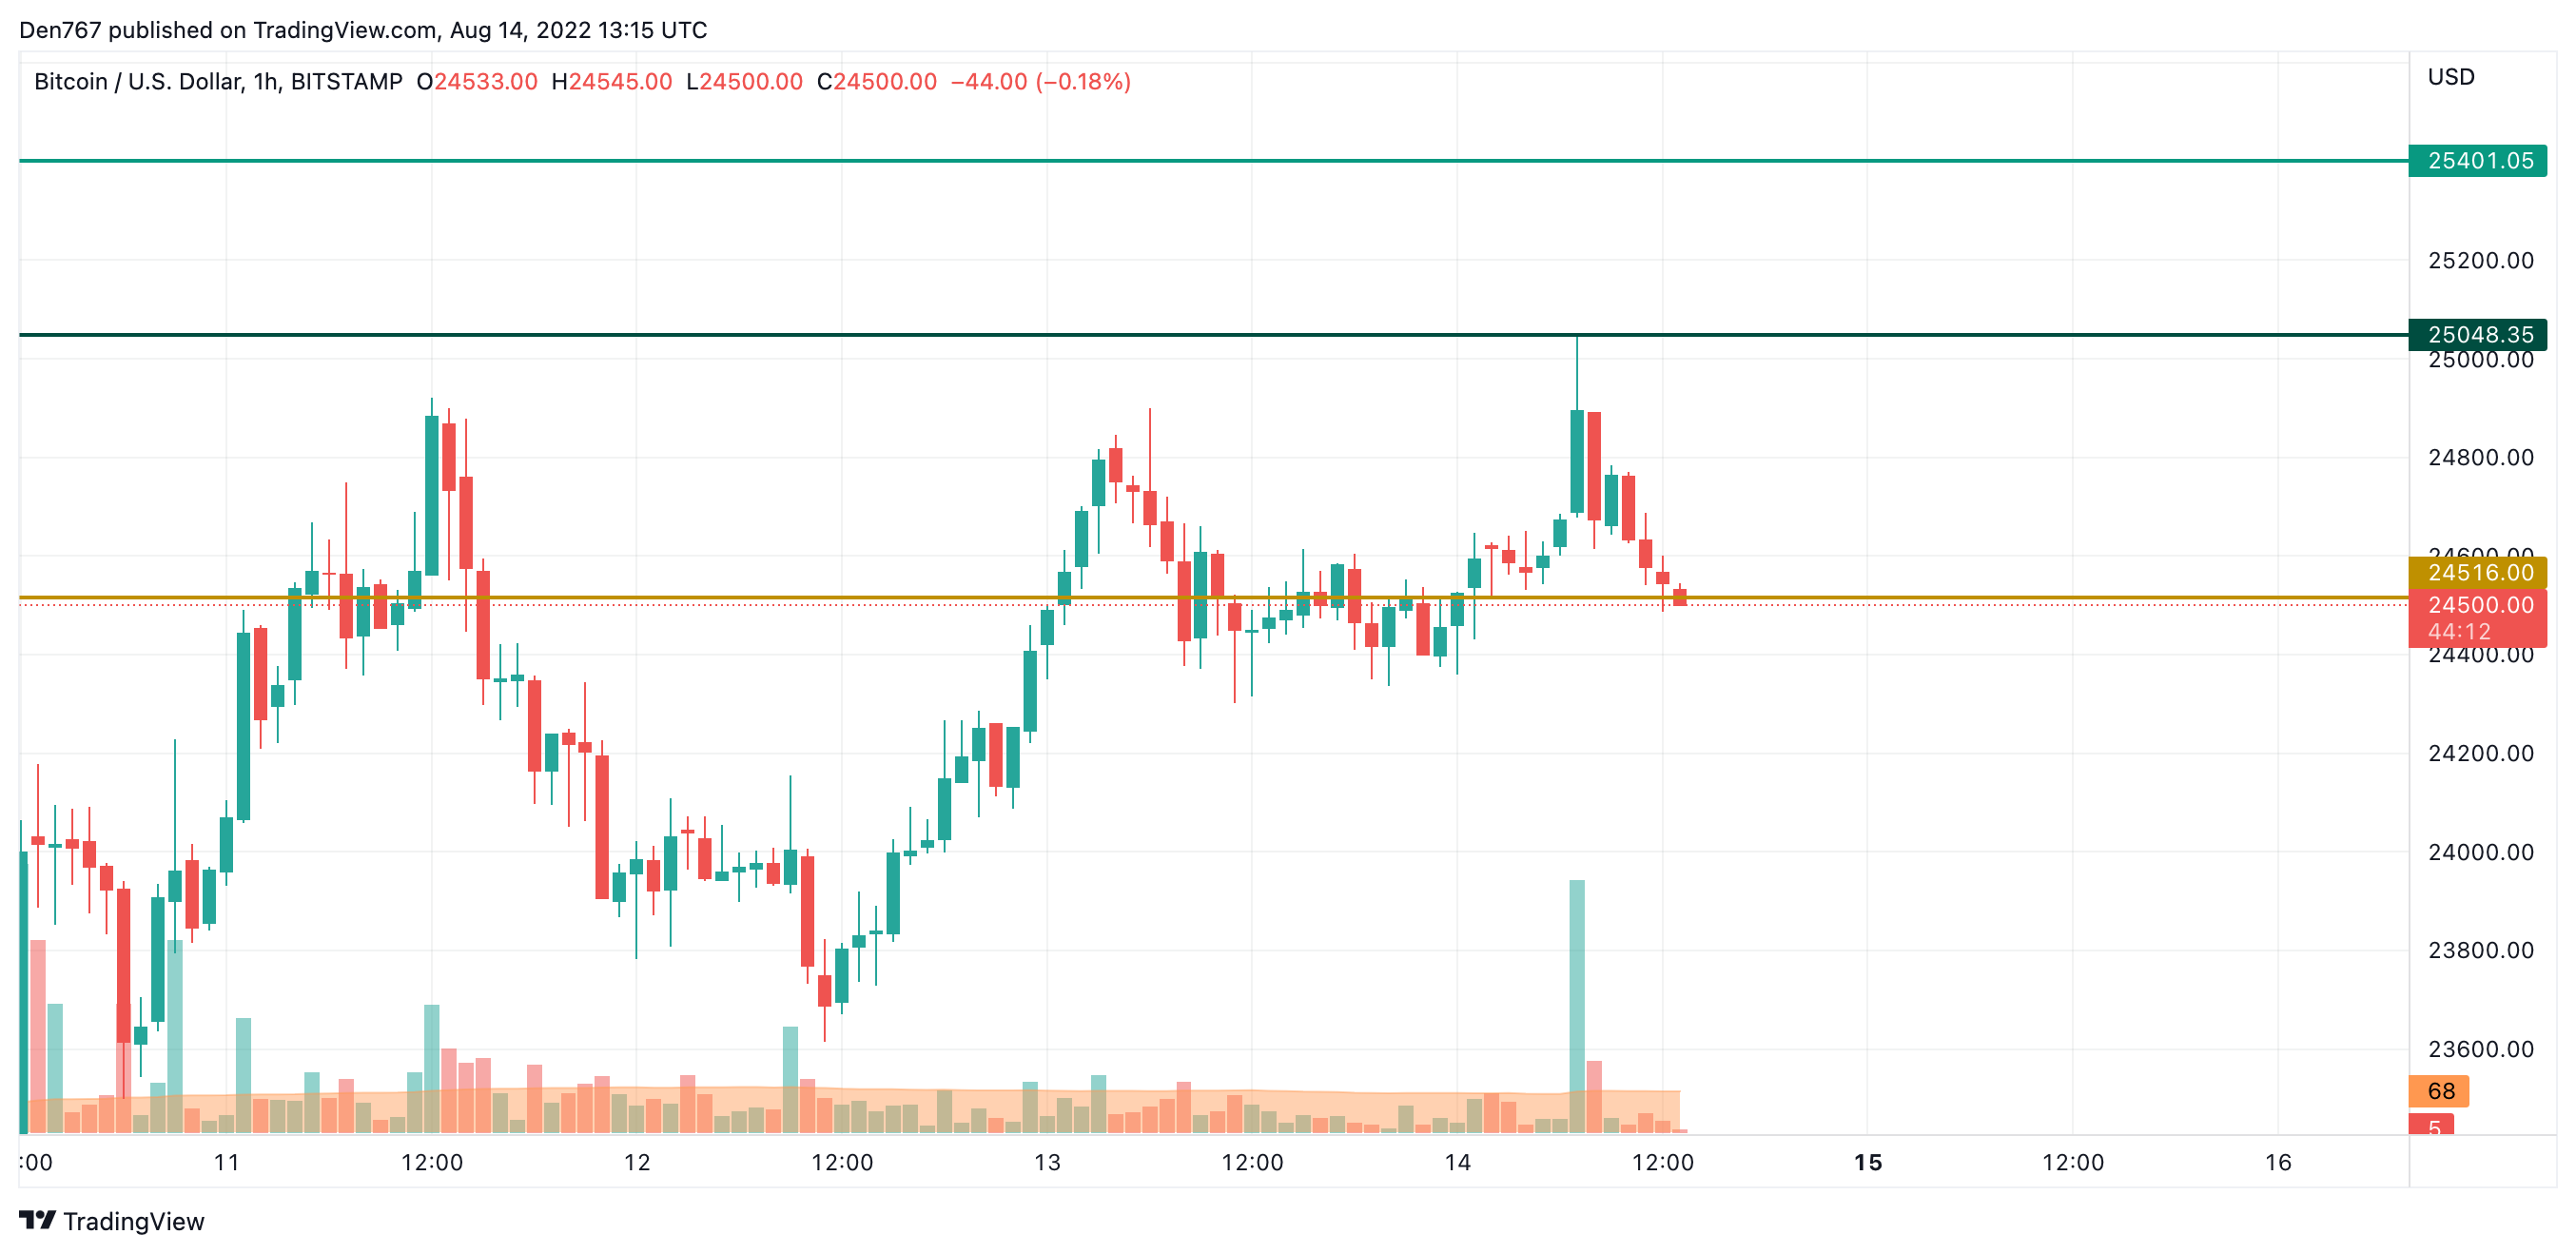
On the hourly chart, Bitcoin (BTC) has broken the local support level at $24,516. If buyers cannot restore the initiative, one can expect a sharp fall to $24,200-$24,400 by the end of the day.
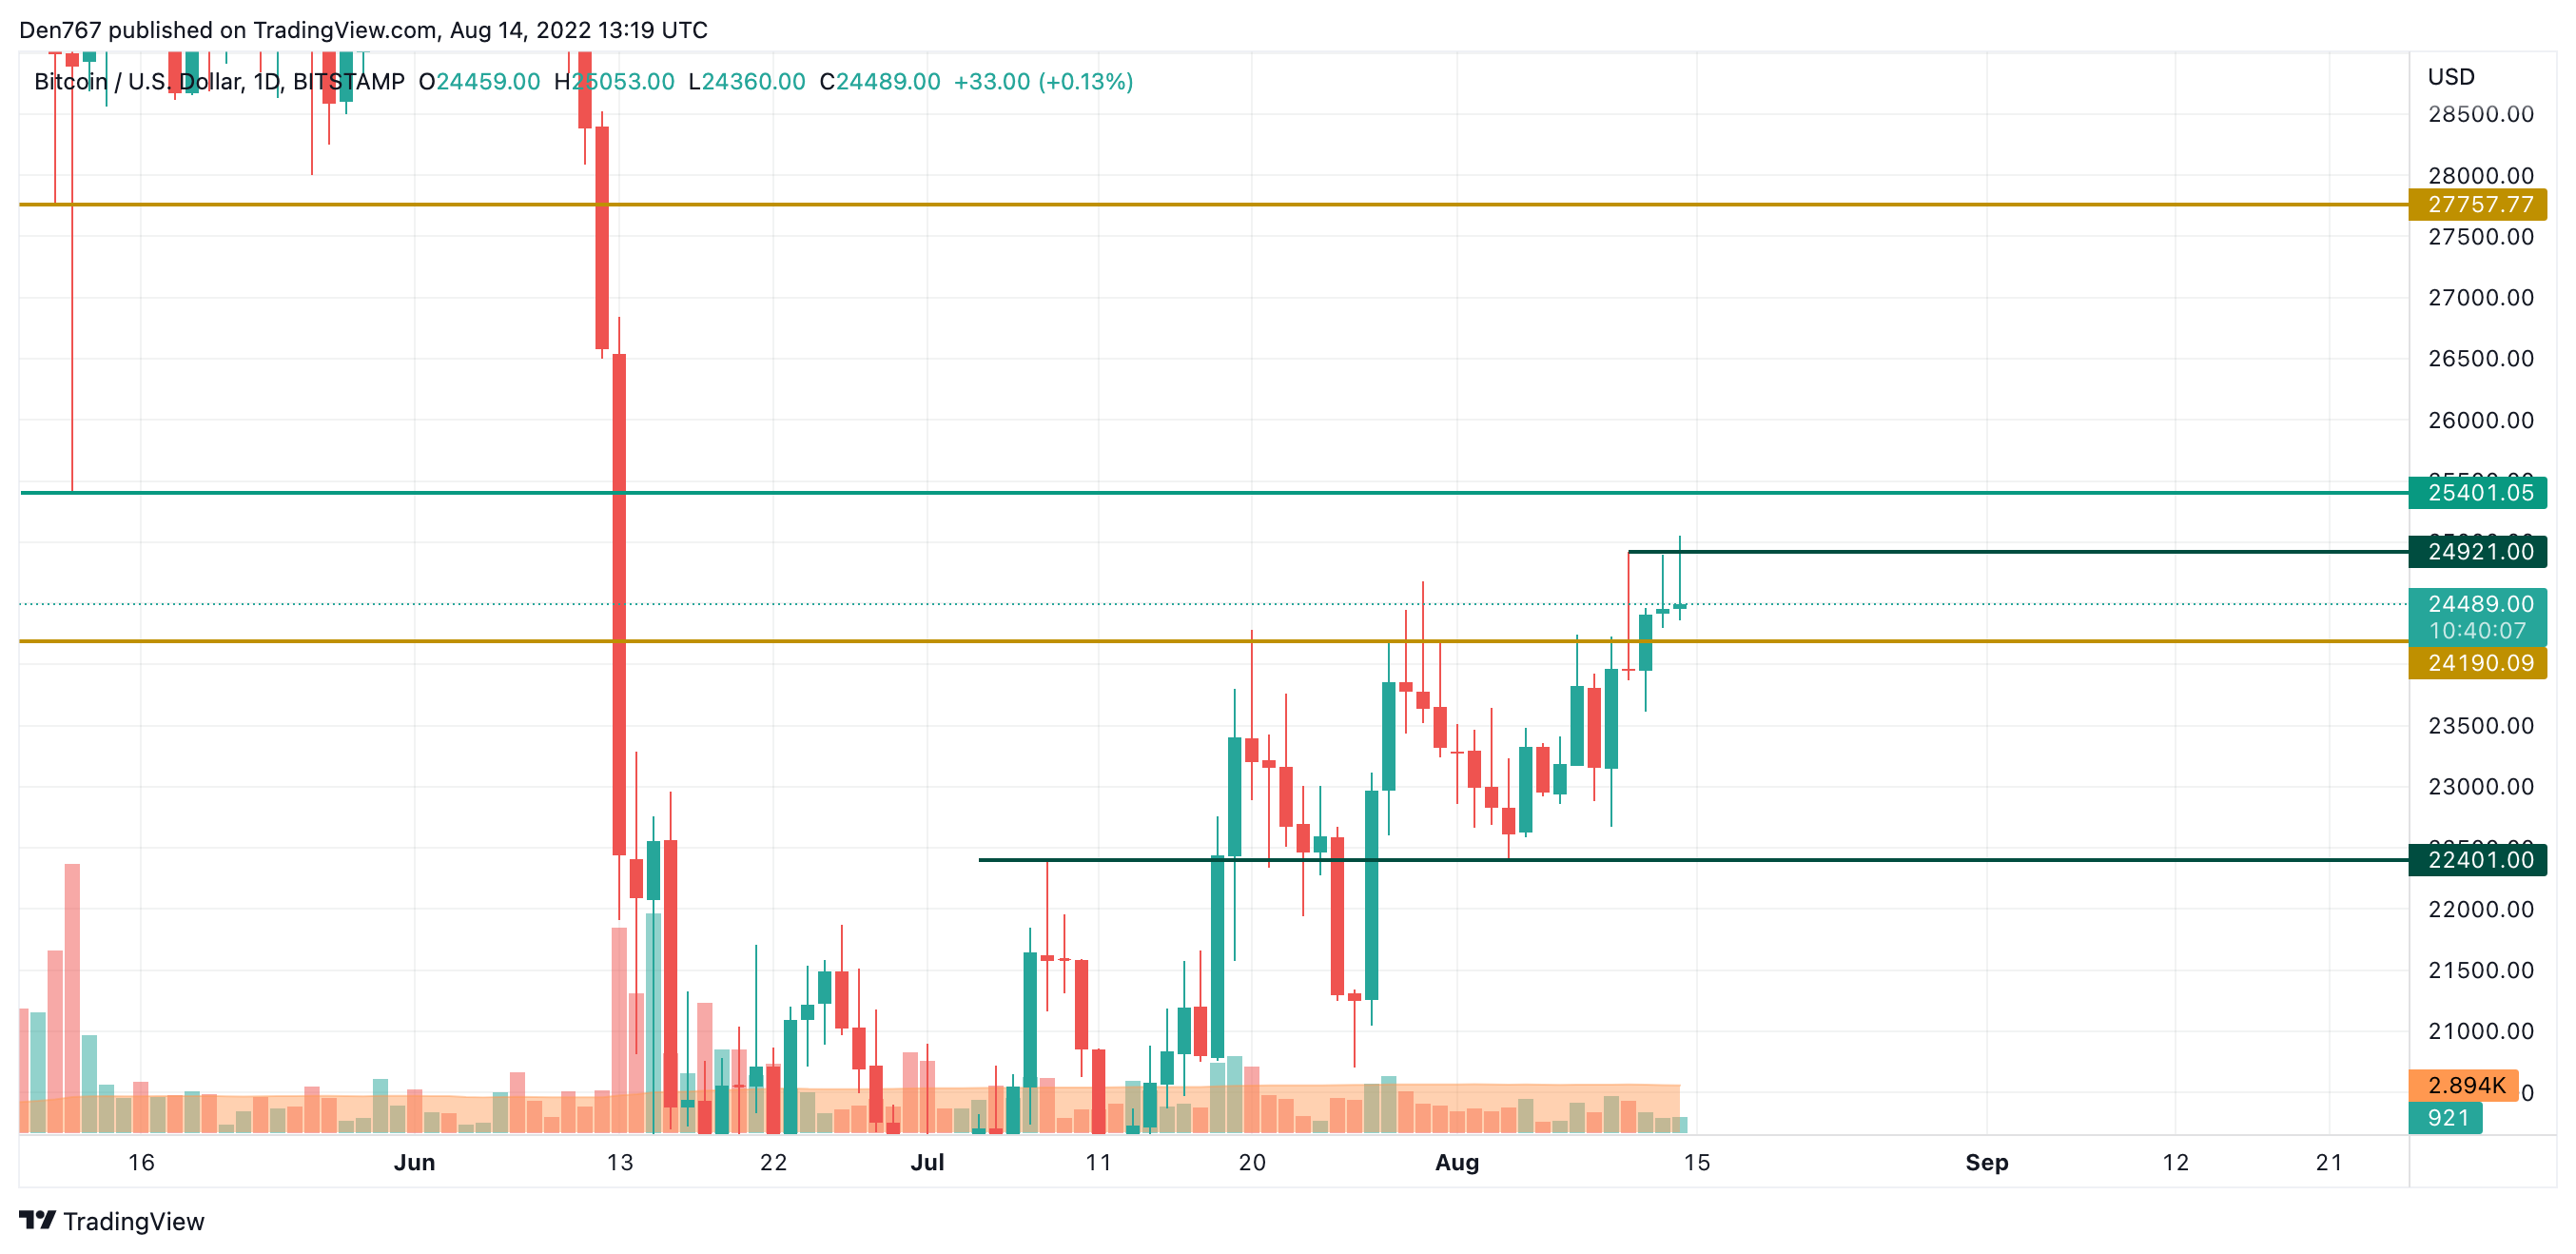
On the larger time frame, Bitcoin (BTC) has made a false breakout of the nearly formed resistance level at $24,921, meaning that bulls are not yet ready to conquer the crucial $25,000 zone.
However, if the rate remains above the support at $24,190, growth may possibly occur soon.
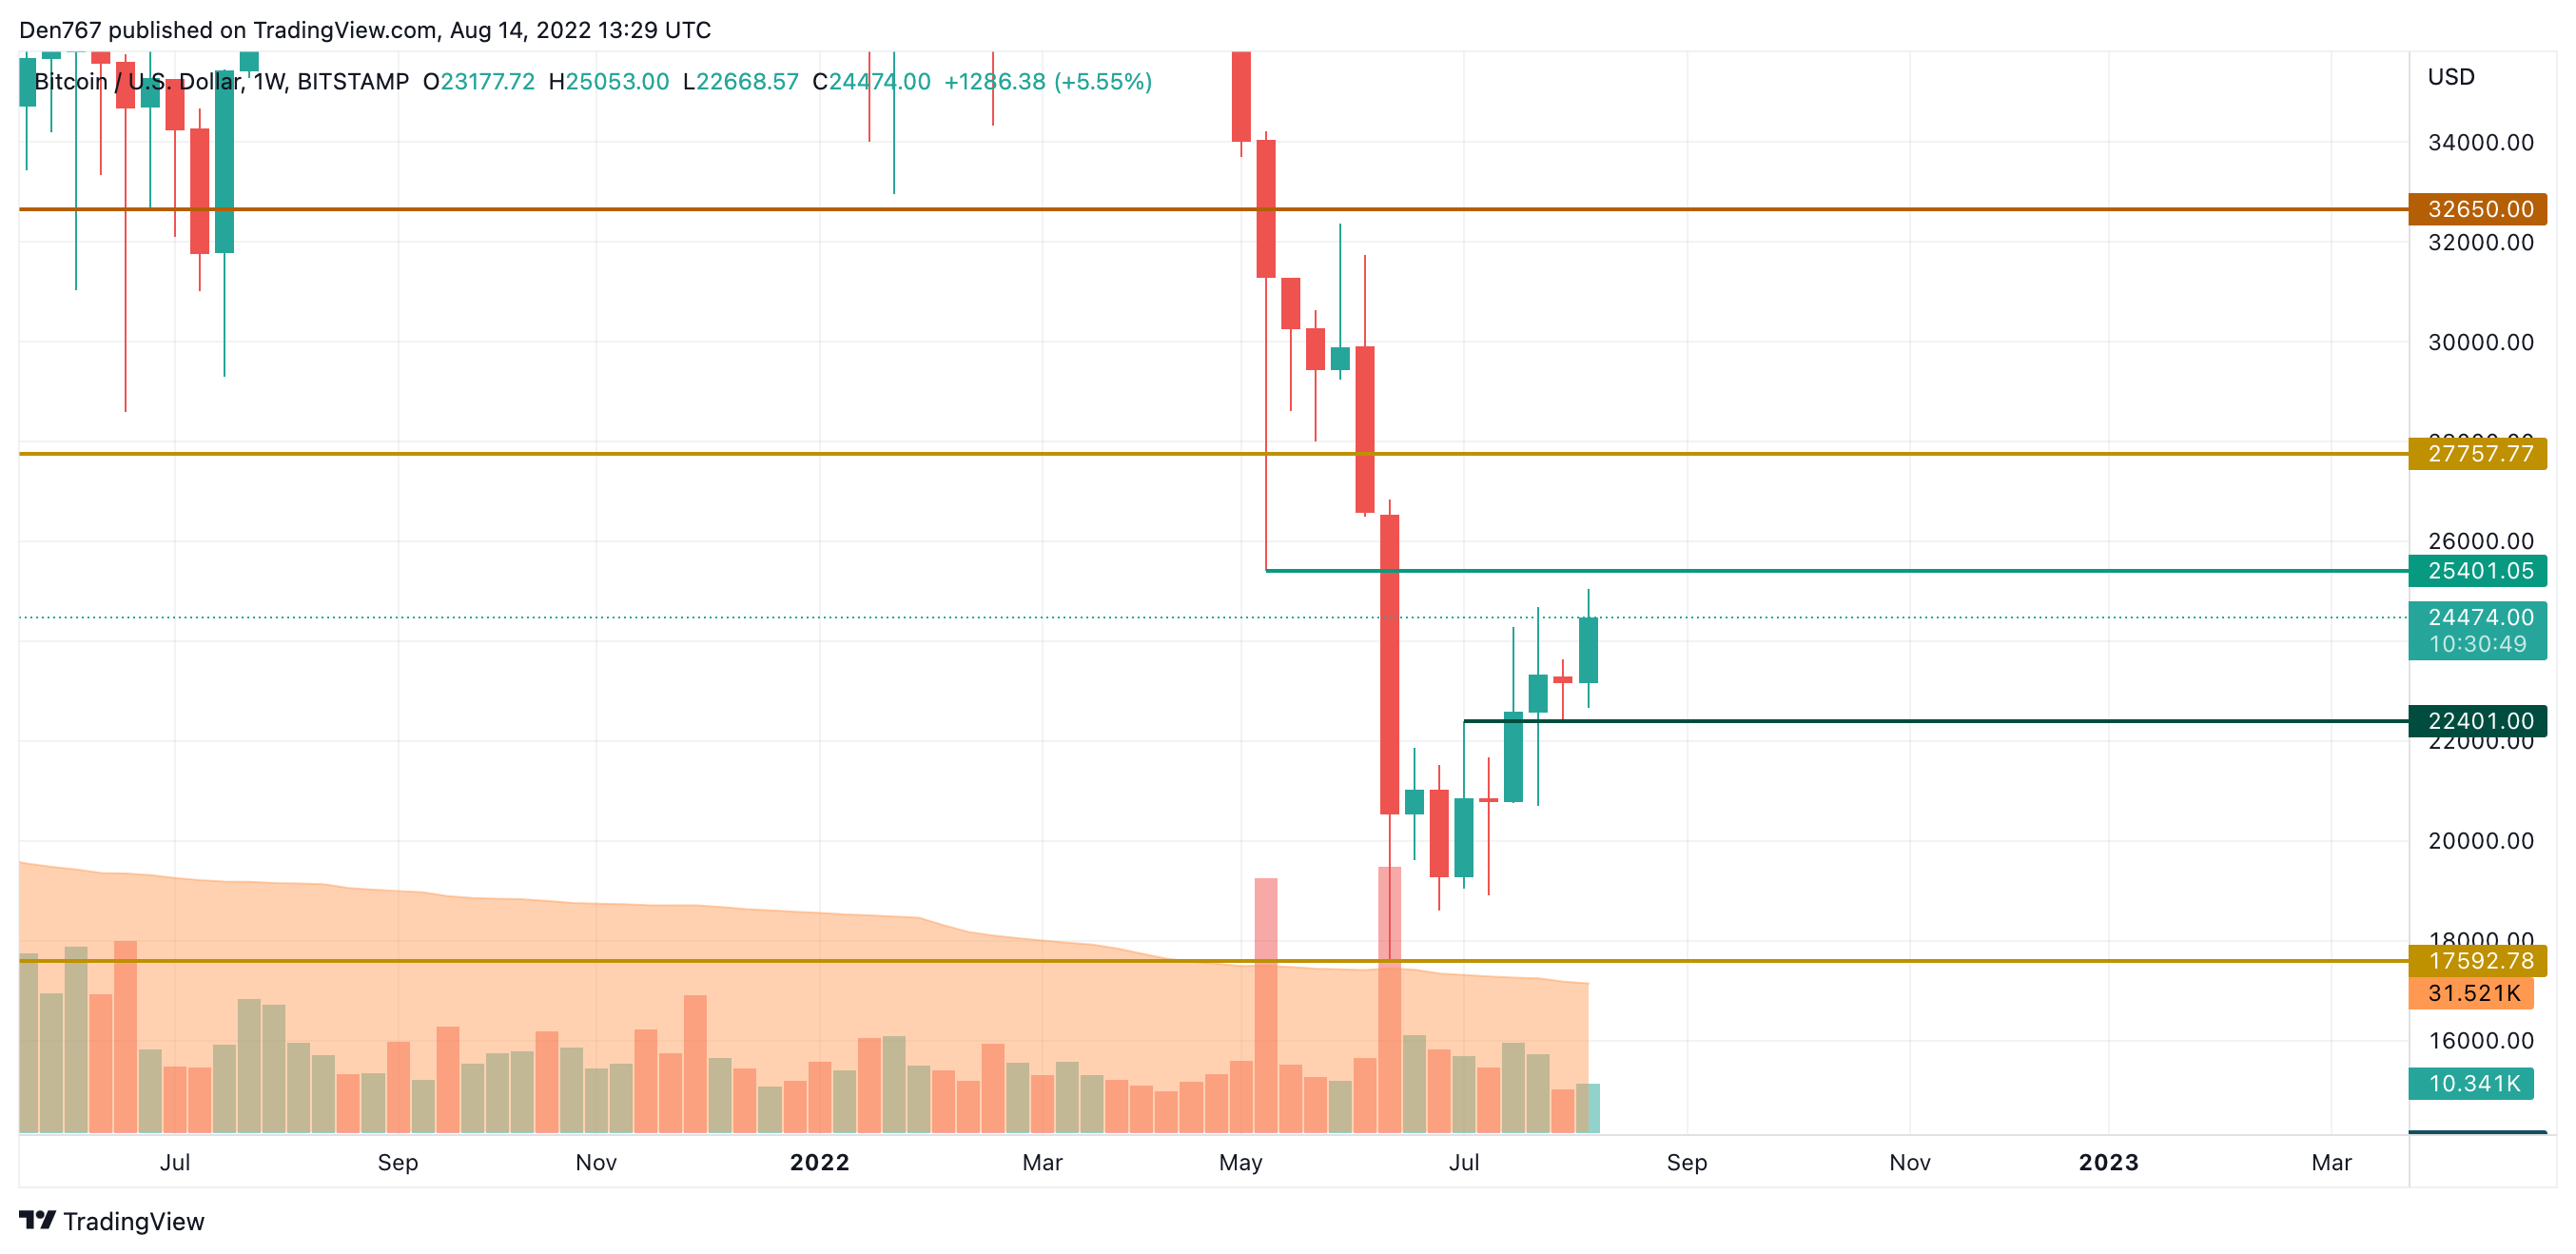
From the midterm point of view, the main cryptocurrency is about to close the weekly candle bullish, confirming buyers’ presence. In this case, the more likely scenario is a test of the mirror level at $25,400 by the end of the current month.
Bitcoin is trading at $24,448 at press time.