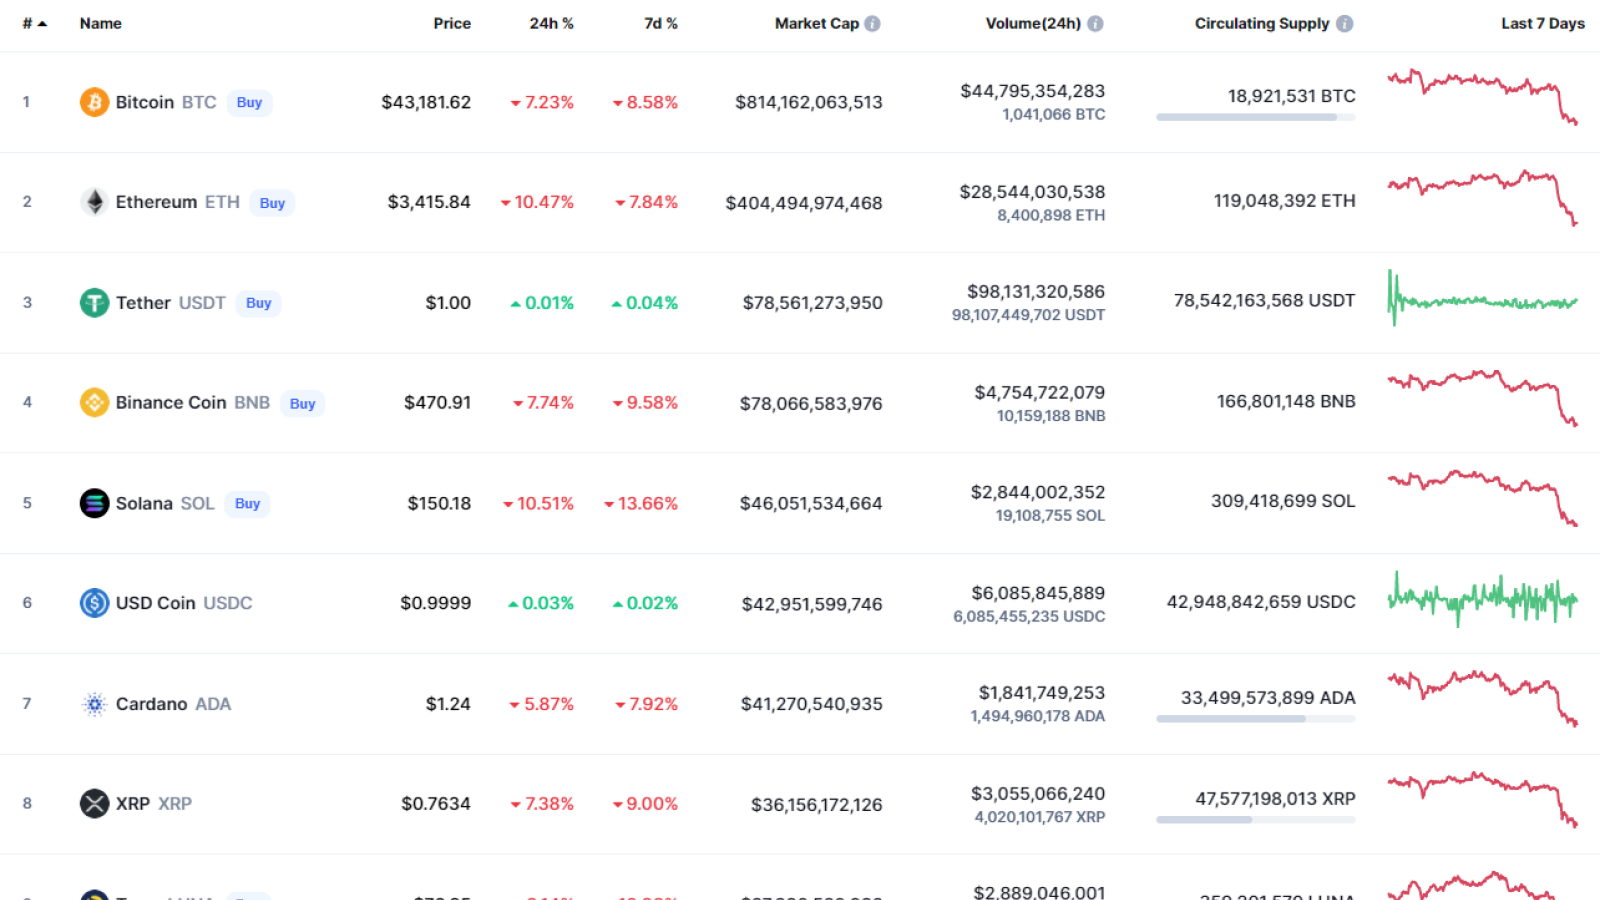
Sellers remain in control as top coins keep trading in the red zone.
BTC/USD
Yesterday, buyers tried to push the price of Bitcoin (BTC) to the area of the two-hour EMA55, but the volume of purchases was too small, and the price could not break above this moving average.
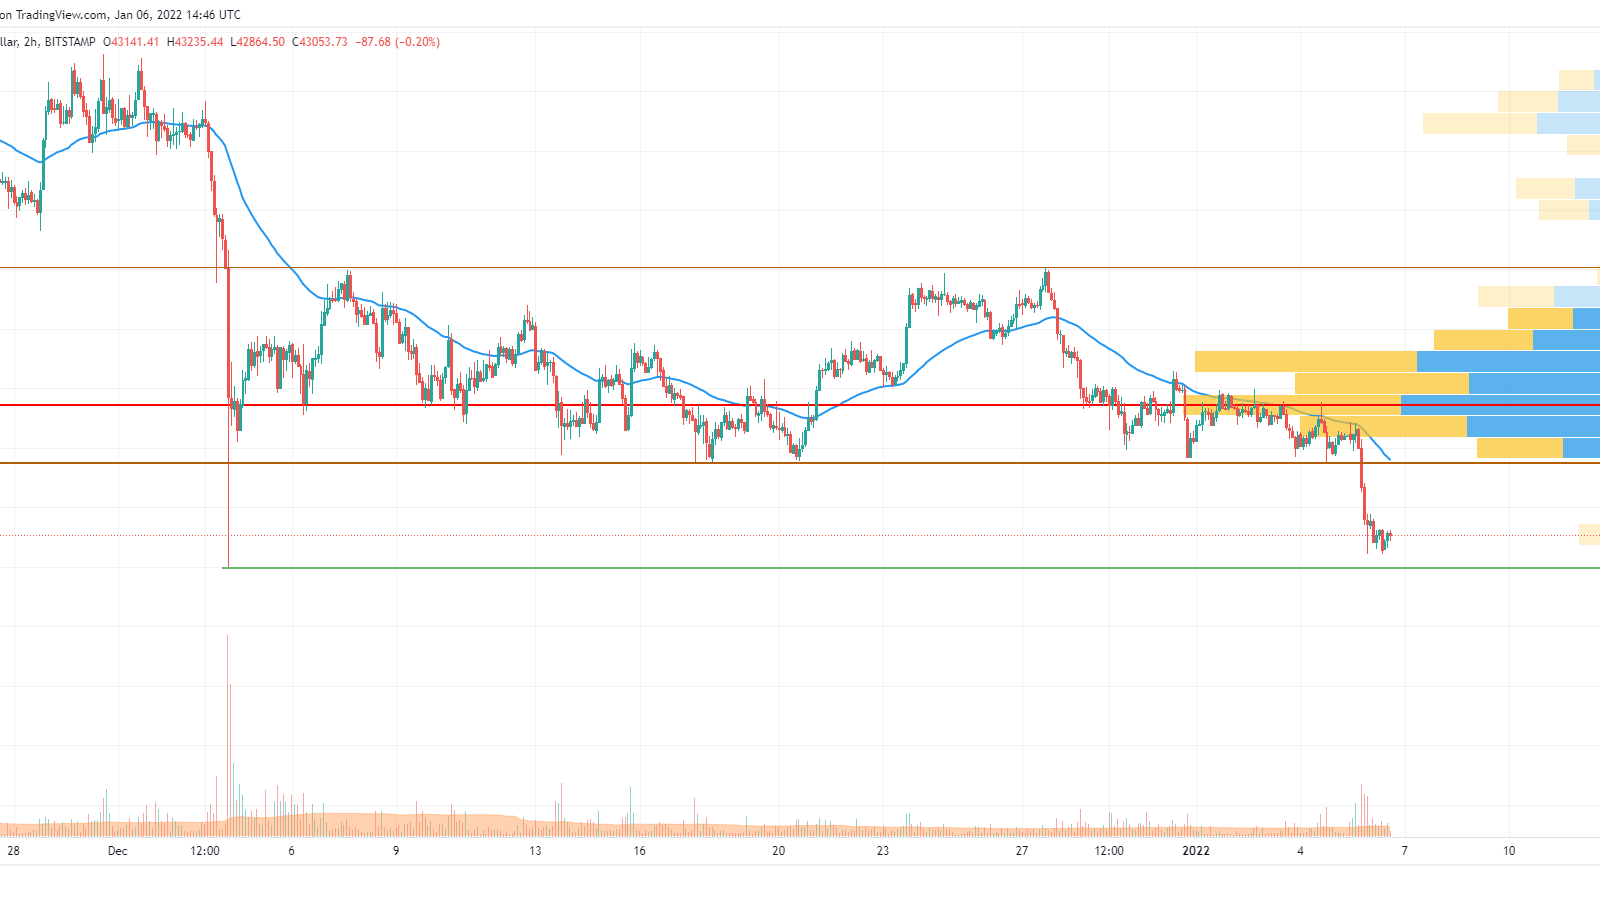
In the evening, bearish pressure quickly increased, and by the end of the day, the BTC price rolled back below $44,000, and then the pair tested the $42,447 level at night.
Since the end of last year, the support of $46,000 kept the market from a negative scenario, but the bears achieved another decline in prices. The capitalization of the entire market has rolled back to the psychological threshold of $2 trillion. The bearish pressure might ease today. In this case, the Bitcoin price can consolidate around the $42,447 level.
Bitcoin is trading at $42,813 at press time.
ETH/USD
Yesterday, the Ethereum (ETH) price tried to hold above the two-hour EMA55. Before lunchtime, the moving average EMA55 still held, but in the evening the selling volumes increased sharply, and the bears broke through the aforementioned level.
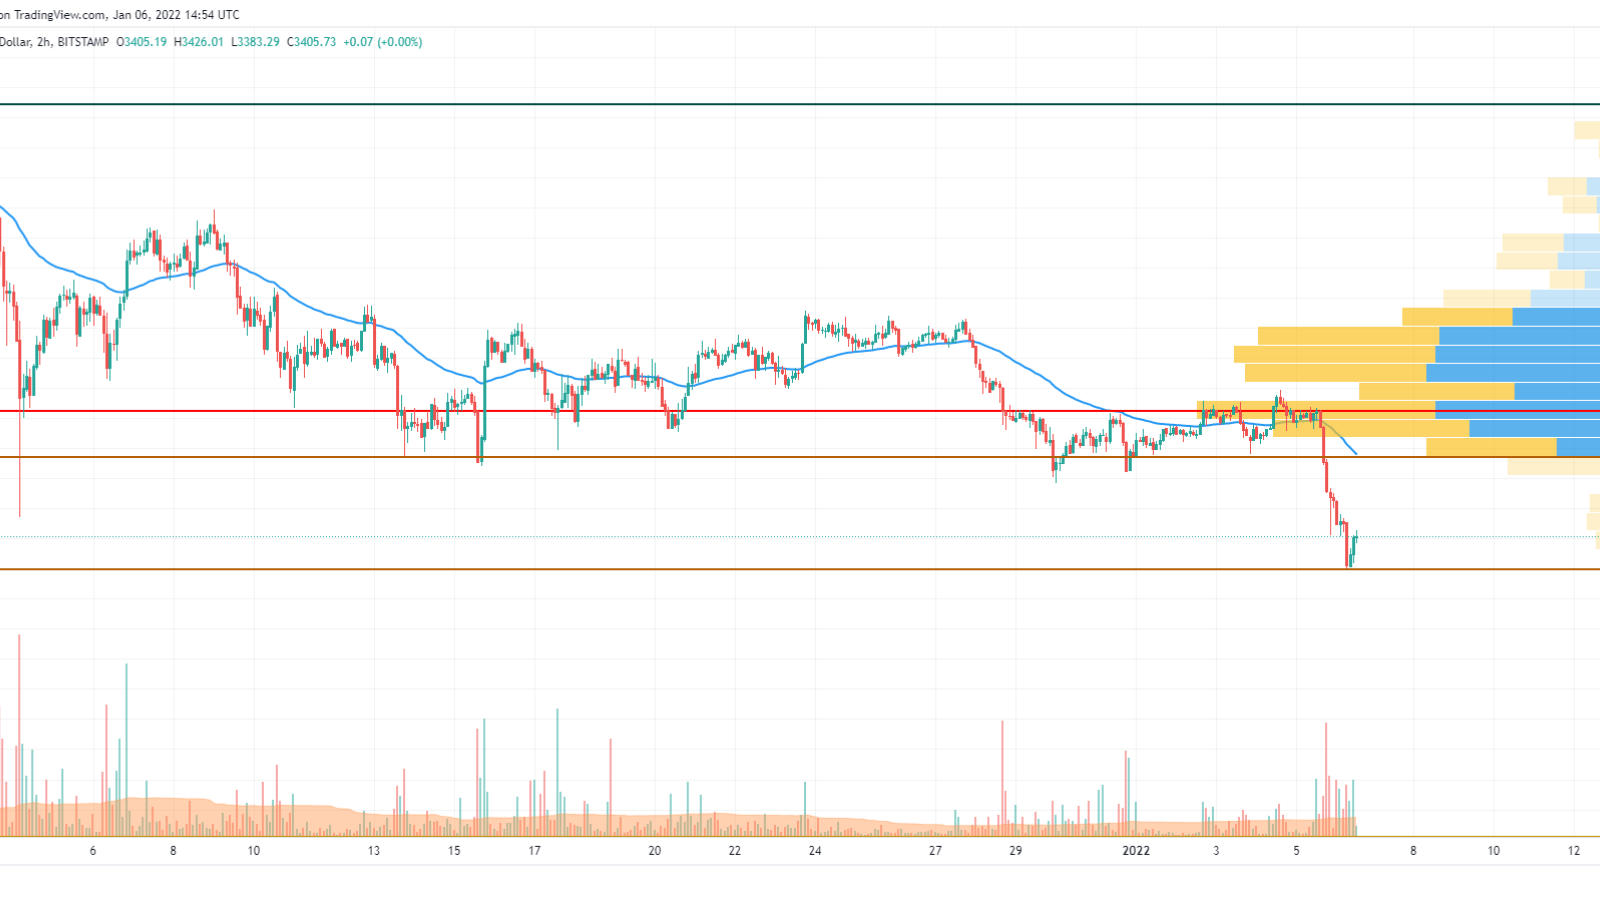
At night, the price fell to support at $3,400, setting a minimum of around $3,410. Despite the small rebound, one believes that the pair can test the level of $3,500 today and slow down the decline in a sideways range with the lower line serving as support.
Ethereum is trading at $3,401 at press time.
DOGE/USD
DOGE has followed the drop of Bitcoin (BTC), going down by 6.76% since yesterday.
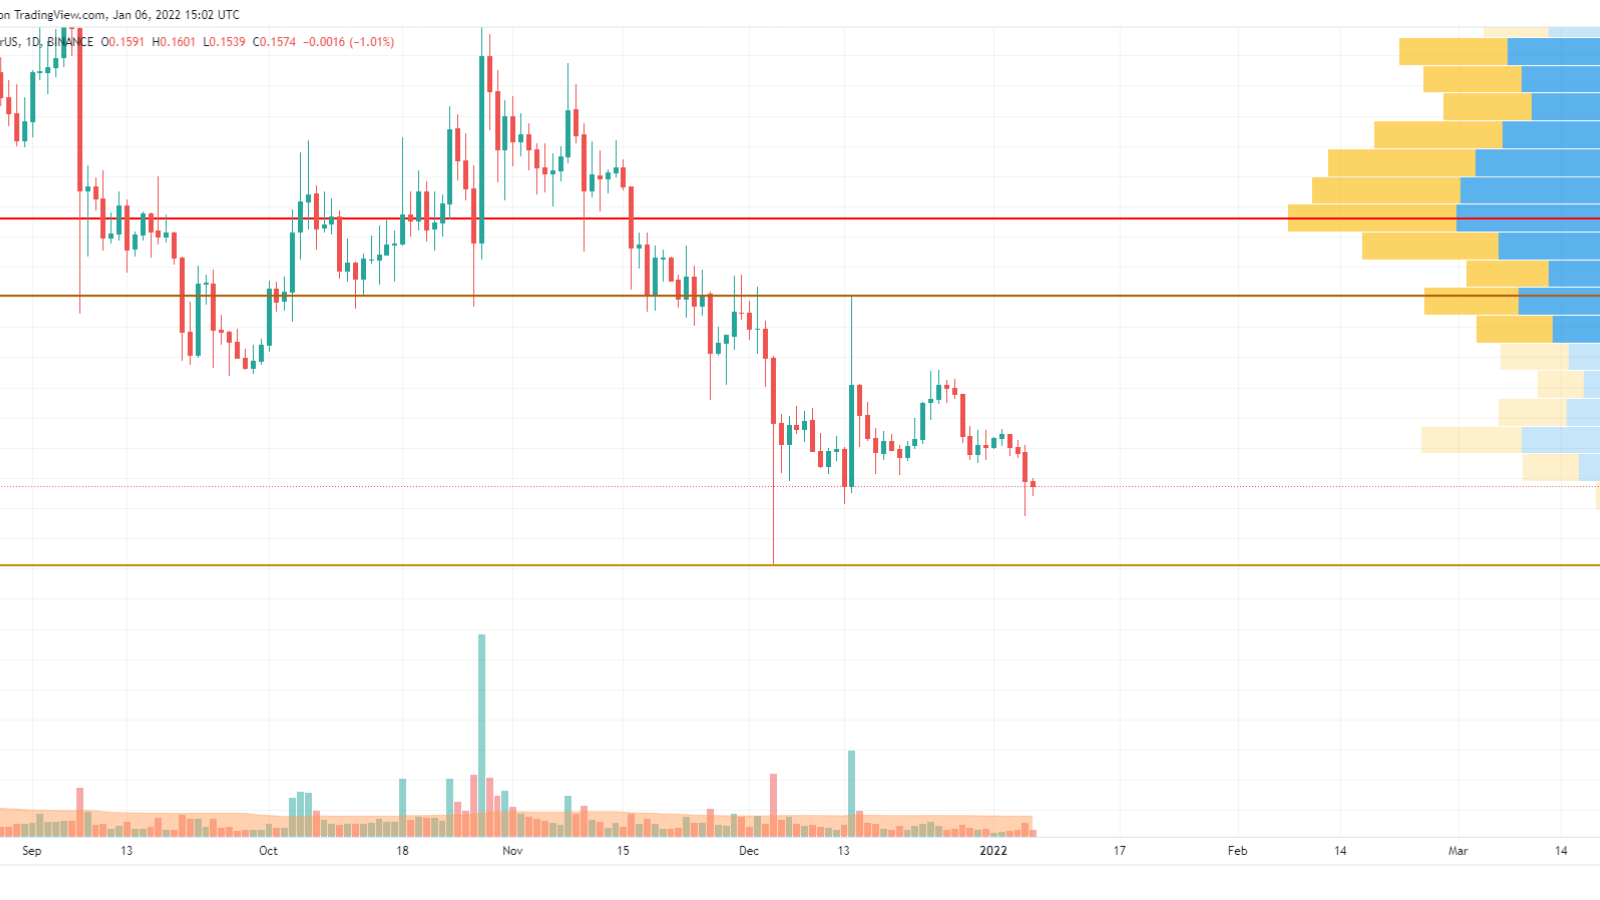
Despite the fall, DOGE is trading above the vital support level at $0.1310. However, bears keep the memecoin under pressure, which is confirmed by the increasing selling volume. If the buyers cannot seize the opportunity, the price might retest the orange level by the end of the week.
DOGE is trading at $0.1572 at press time.
SHIB/USD
SHIB is underperforming DOGE today, dropping by 8% over the last 24 hours.
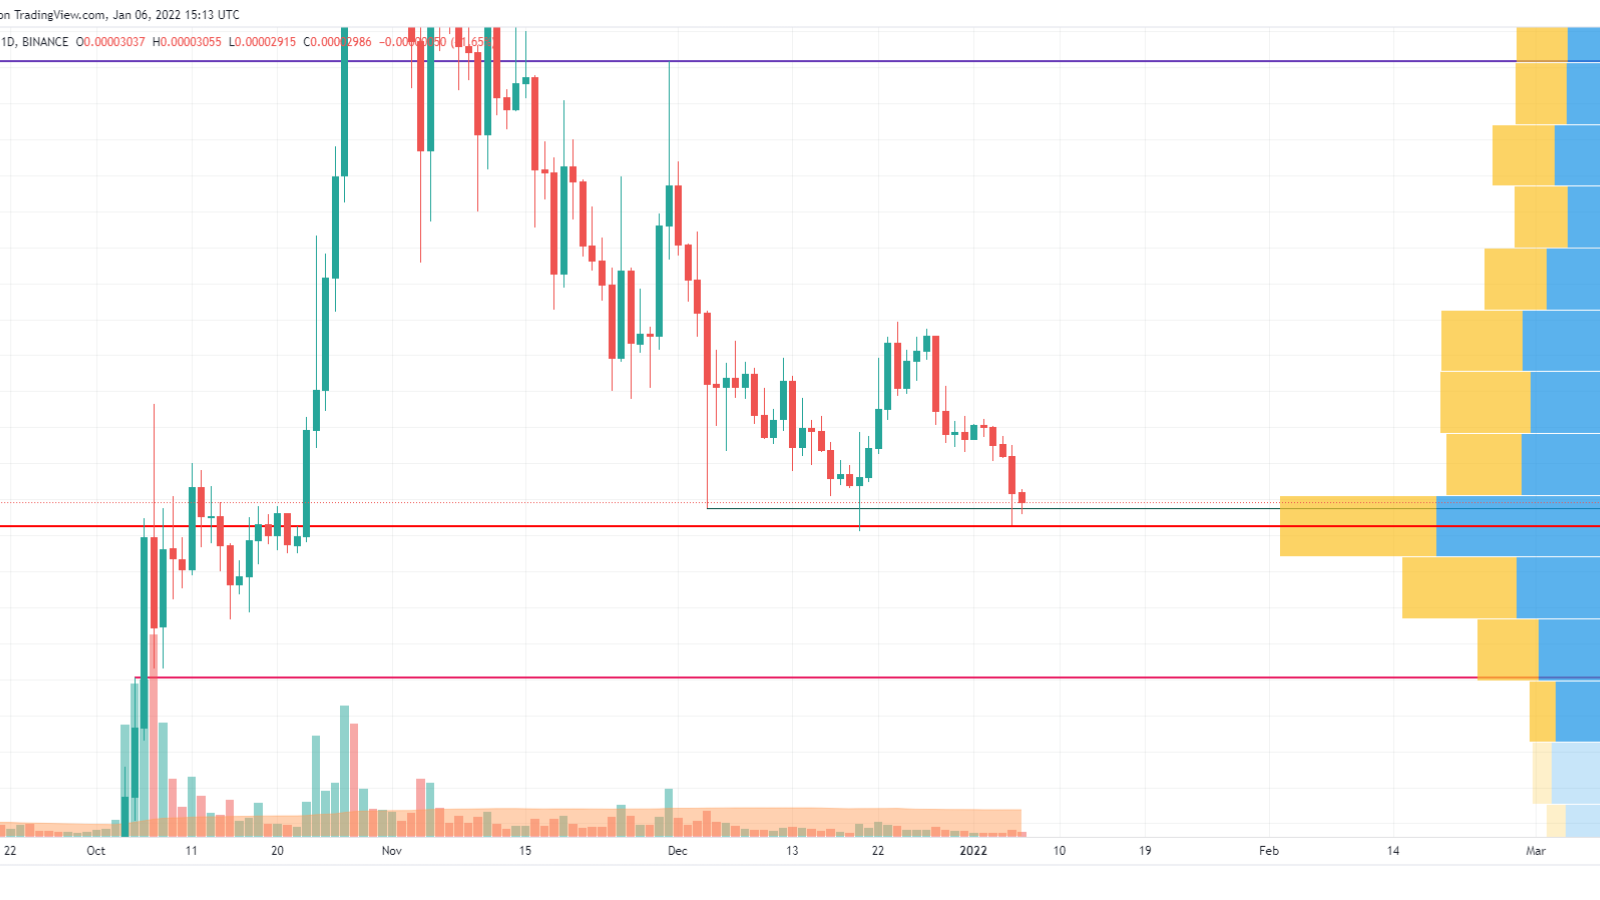
SHIB is coming back to the support level at $0.00002952 after its false breakout. If the pressure continues to mount, and the daily candle fixes below this mark, one may expect a further price decrease to the next important zone around $0.00002010. Such a scenario is relevant until mid-January.
SHIB is trading at $0.00002998 at press time.

