
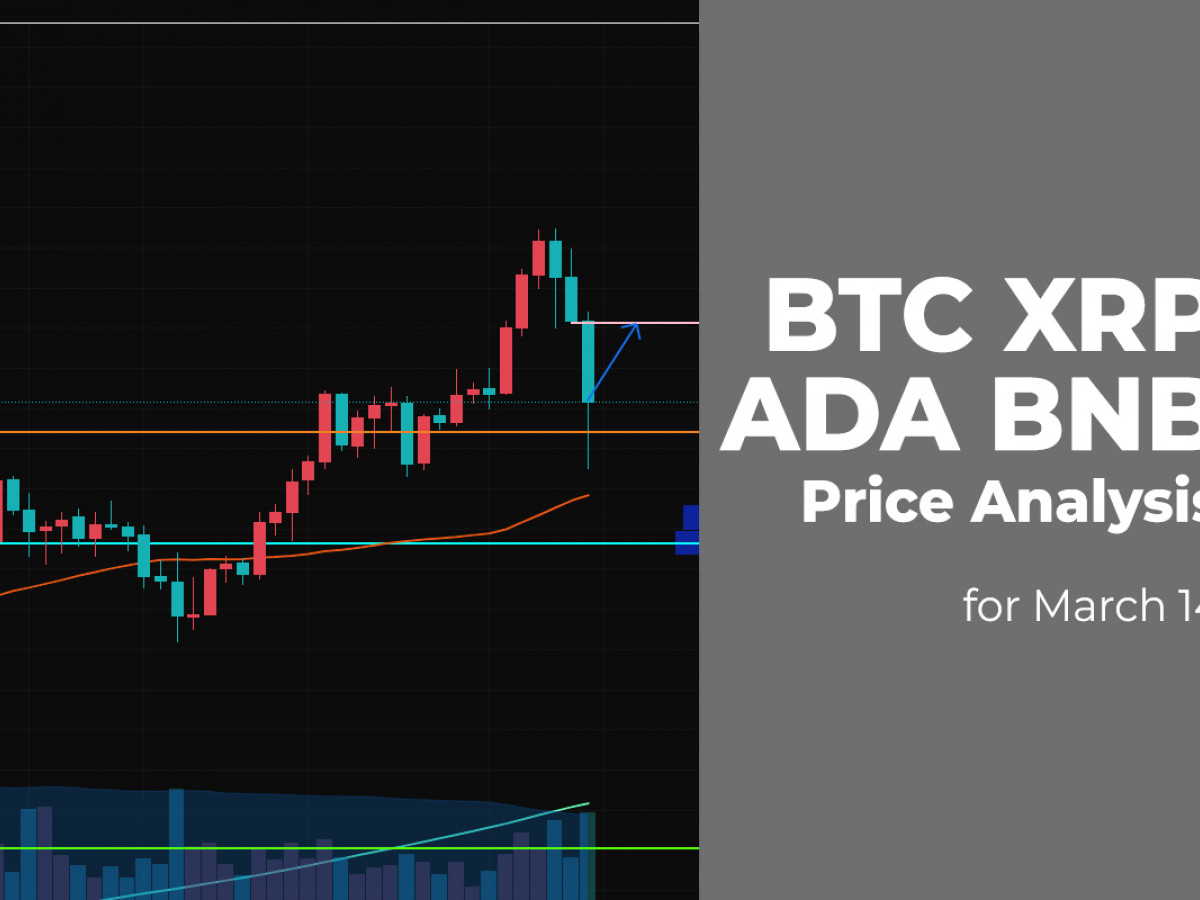

How great are the chances to see growth of the market by the end of the month?
The new week has begun with a neutral mood on the cryptocurrency market as some digital assets are in the red zone, while others are rising.
BTC/USD
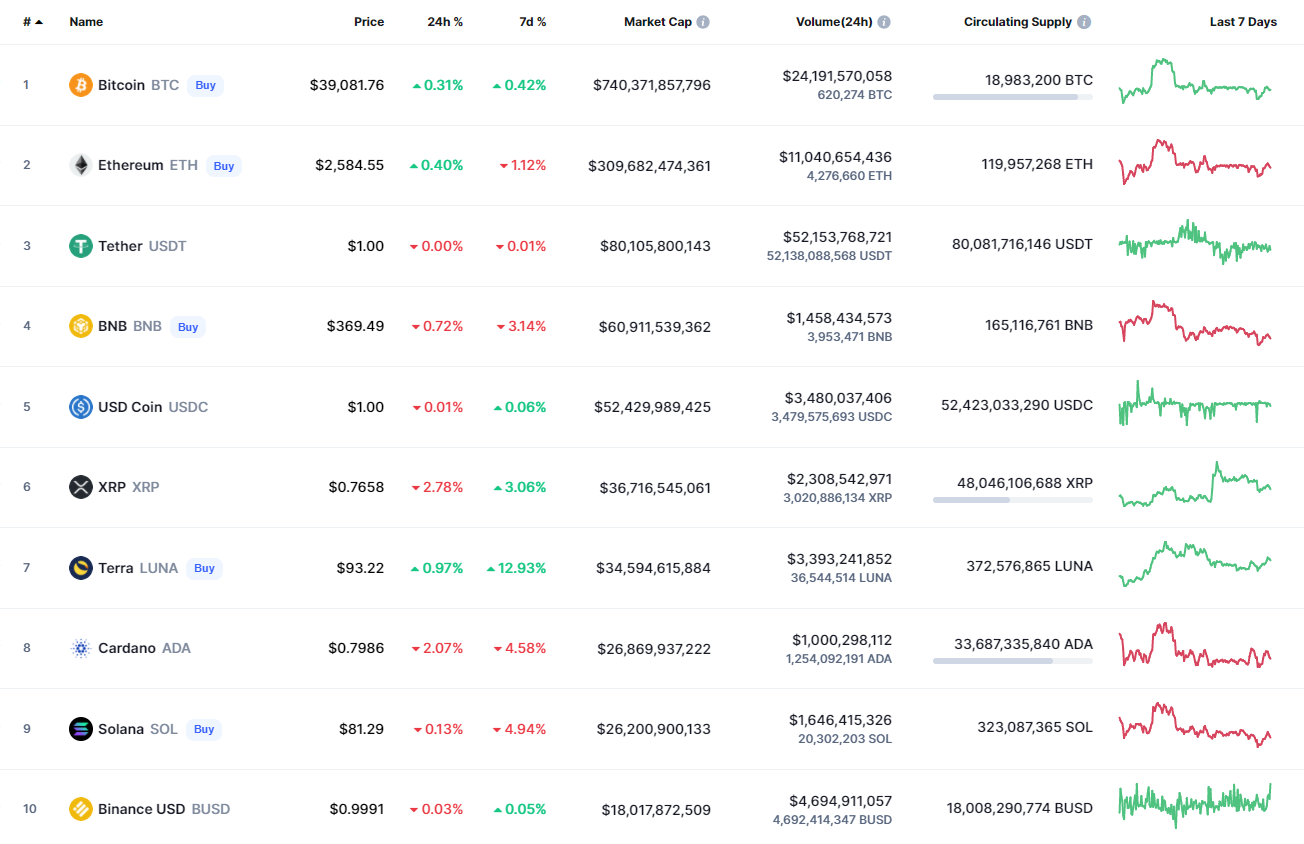
The rate of Bitcoin (BTC) has risen by 0.16% over the last 24 hours.
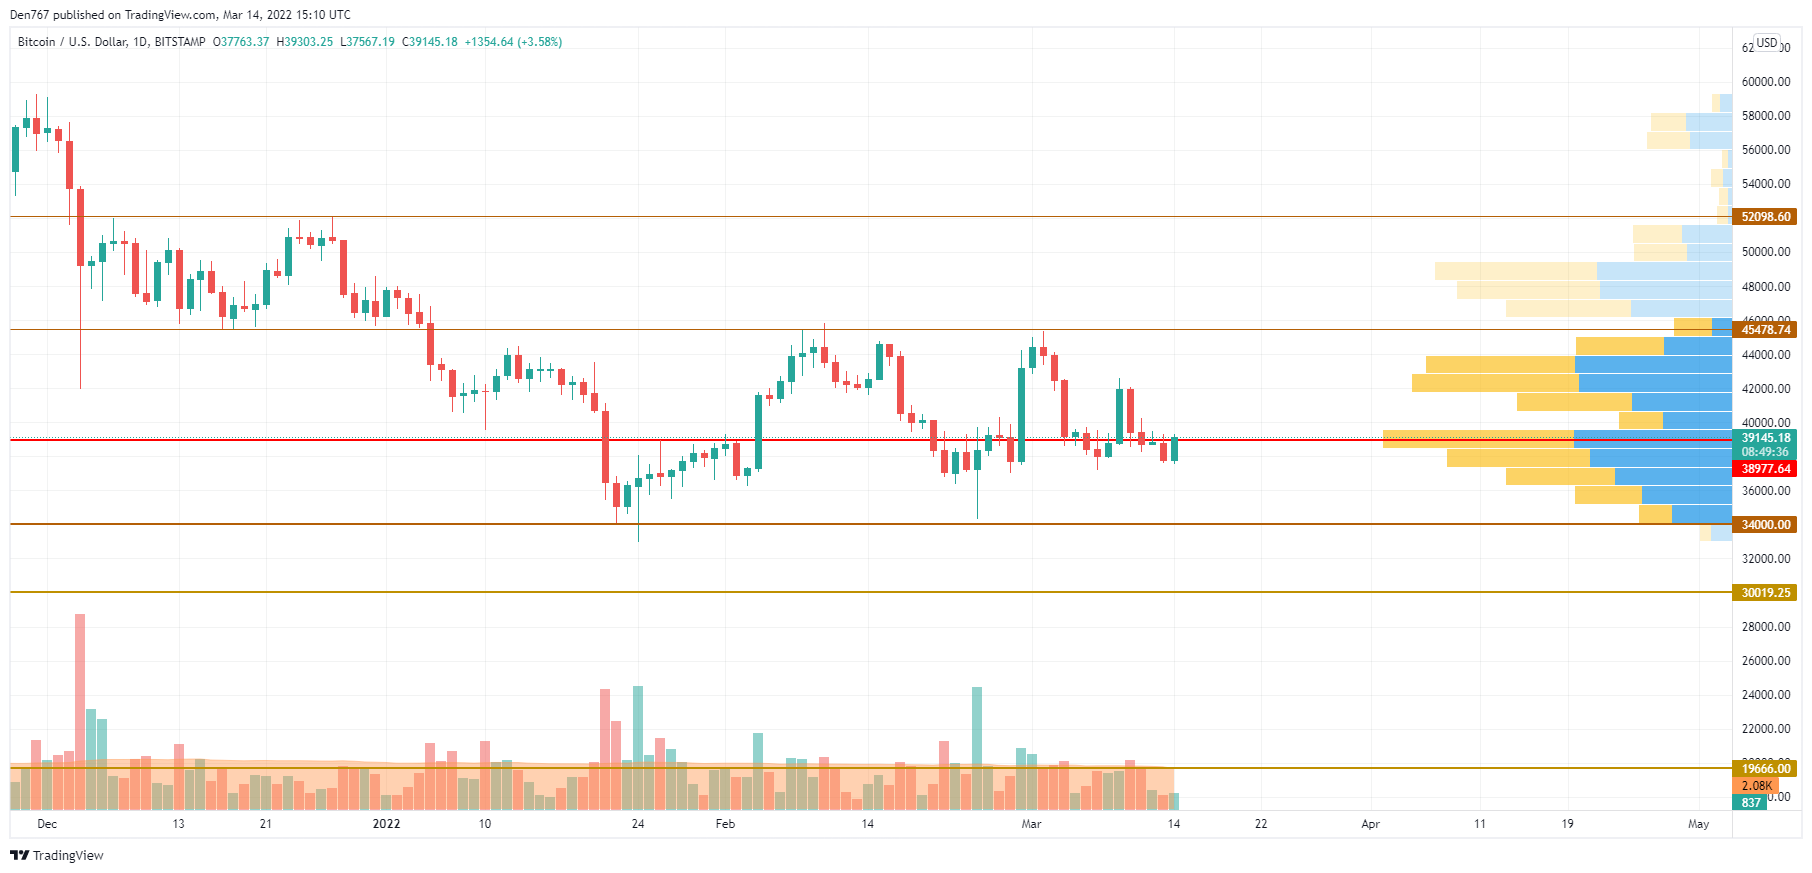
Despite the slight rise, the main crypto is trading in the zone of the most liquidity, accumulating power for a further sharp move. Such a statement is confirmed by the declining trading volume, which means that none of the sides is ready for either growth or decline.
However, if buyers manage to get to the vital level of $40,000, there is a possibility of seeing the test of the resistance shortly.
Bitcoin is trading at $39,092 at press time.
XRP/USD
XRP is the biggest loser from the list today, falling by almost 3% since yesterday.
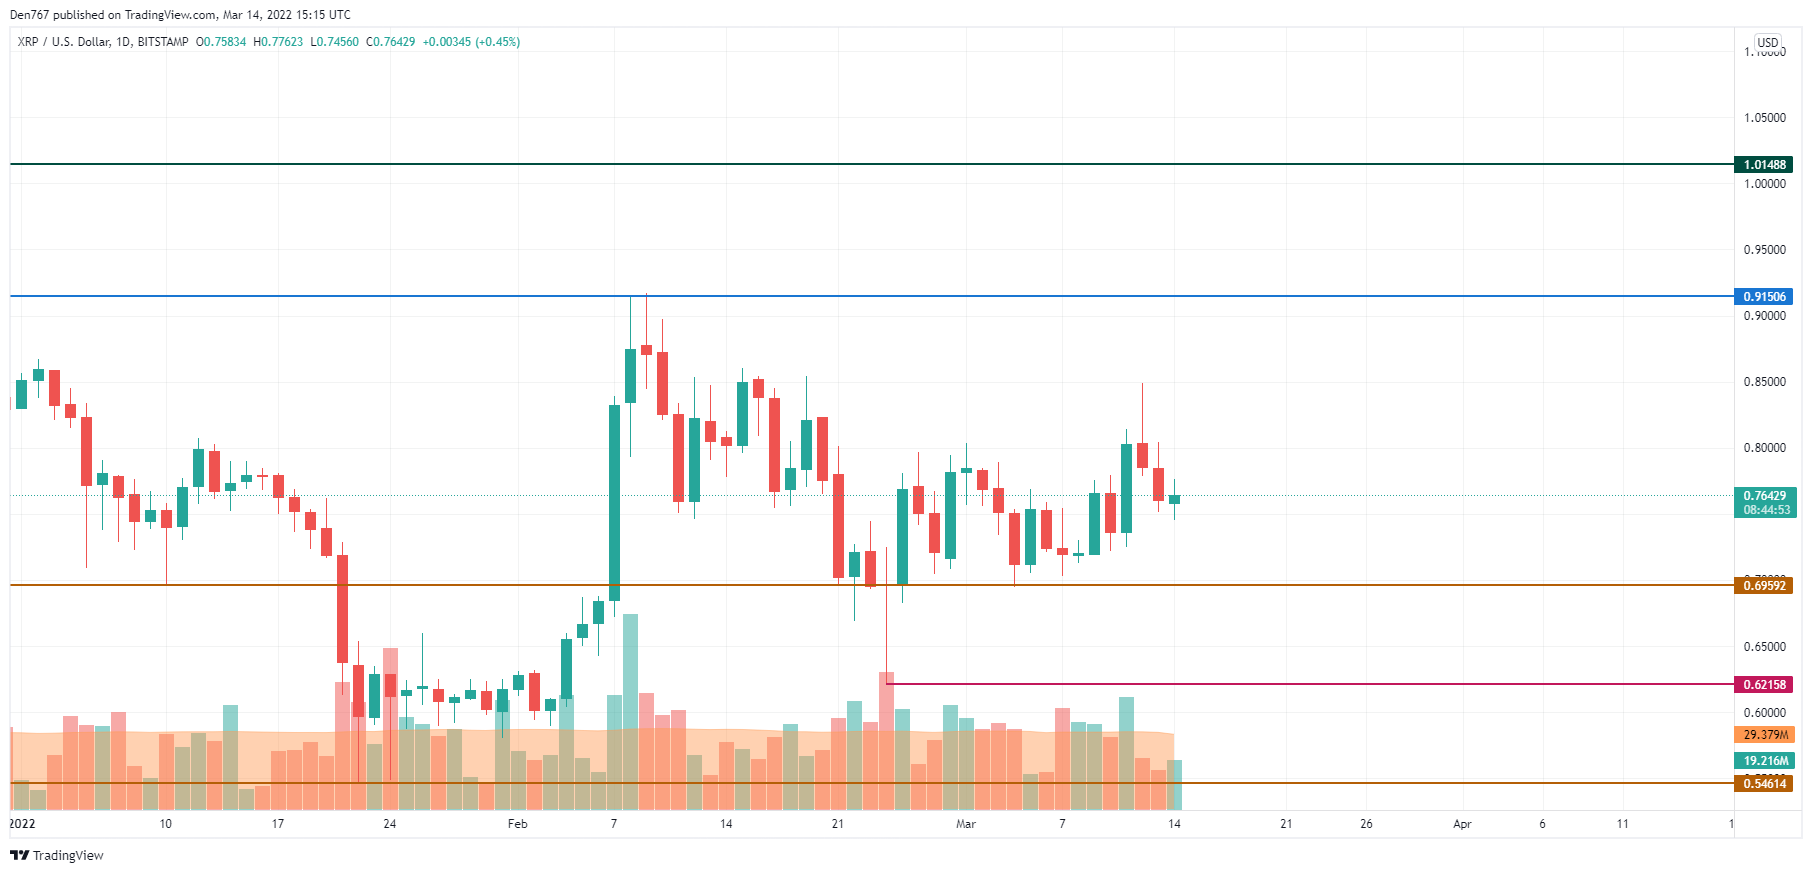
XRP is trading similarly to Bitcoin (BTC) as sideways trading remains the more likely scenario until the end of the month. From another point of view, the buying trading volume has started to grow, which means that bulls are not ready to give up.
If the daily candle closes around the $0.80 mark, the rise may continue to the blue line ($0.91) until the end of the month.
XRP is trading at $0.7645 at press time.
ADA/USD
Cardano (ADA) has followed the decline of XRP, going down by 2.12%.
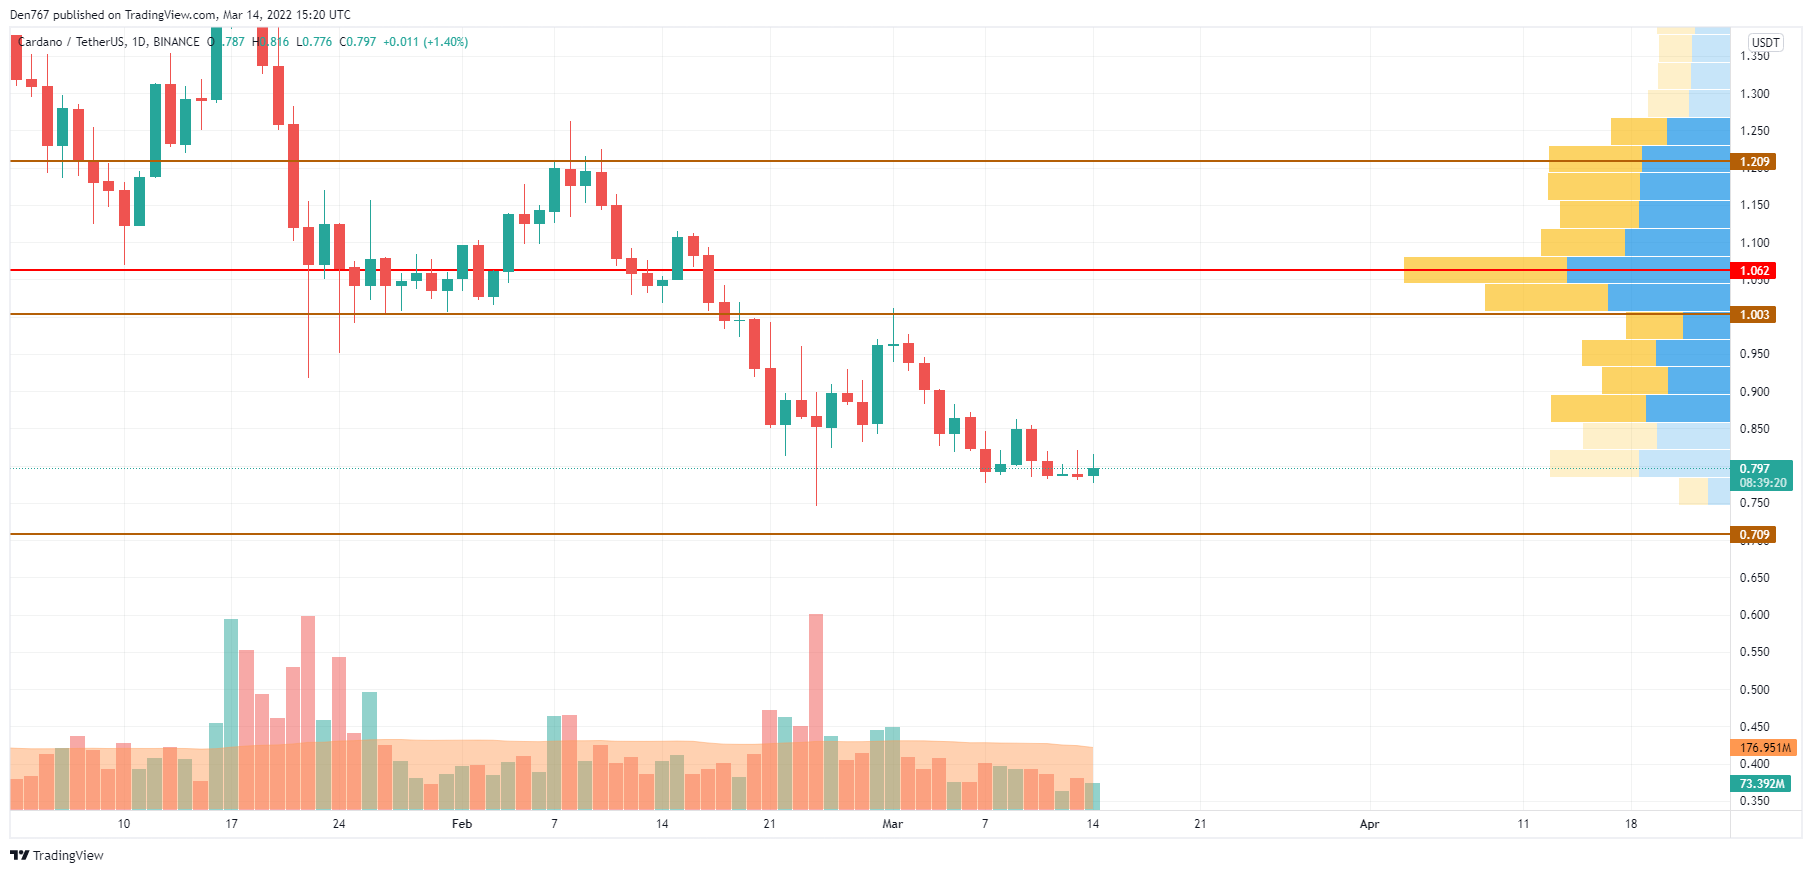
Cardano (ADA) is looking worse than XRP as the rate is approaching the support level at $0.709. Thus, the buying trading volume is also going down, which means that bulls are not willing to buy the altcoin at the current levels. If the bears’ pressure continues and the rate closes below the support, one can expect the sharp drop soon.
ADA is trading at $0.797 at press time.
BNB/USD
Binance Coin (BNB) has declined by 0.75% over the last days.
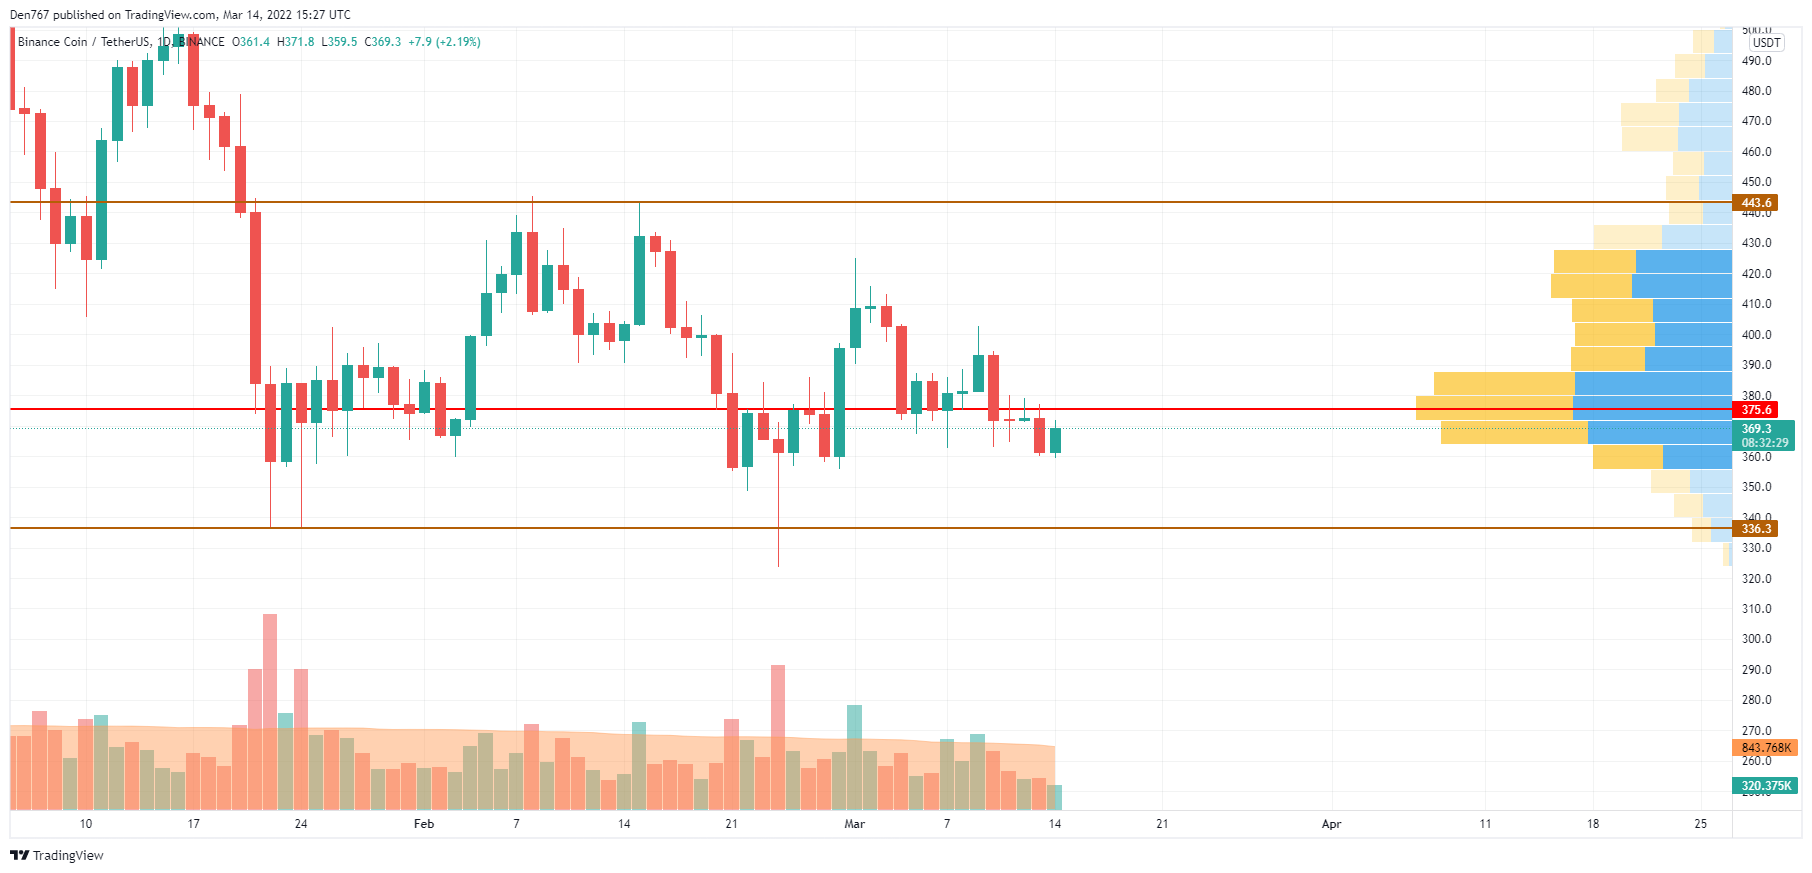
Binance Coin (BNB) is located below the zone of the most liquidity at $375. Until it is below it, bears remain more powerful than bulls. If buyers want to seize the initiative and start the short-term rise, the native exchange coin should come back to the area around $400 on the daily chart. If they fail to do that, the decline may lead the rate to the support level within the next few days.
BNB is trading at $368 at press time.