
On the last day of the week, bulls could not hold the initiative as most of the coins are again in the red zone.
BTC/USD
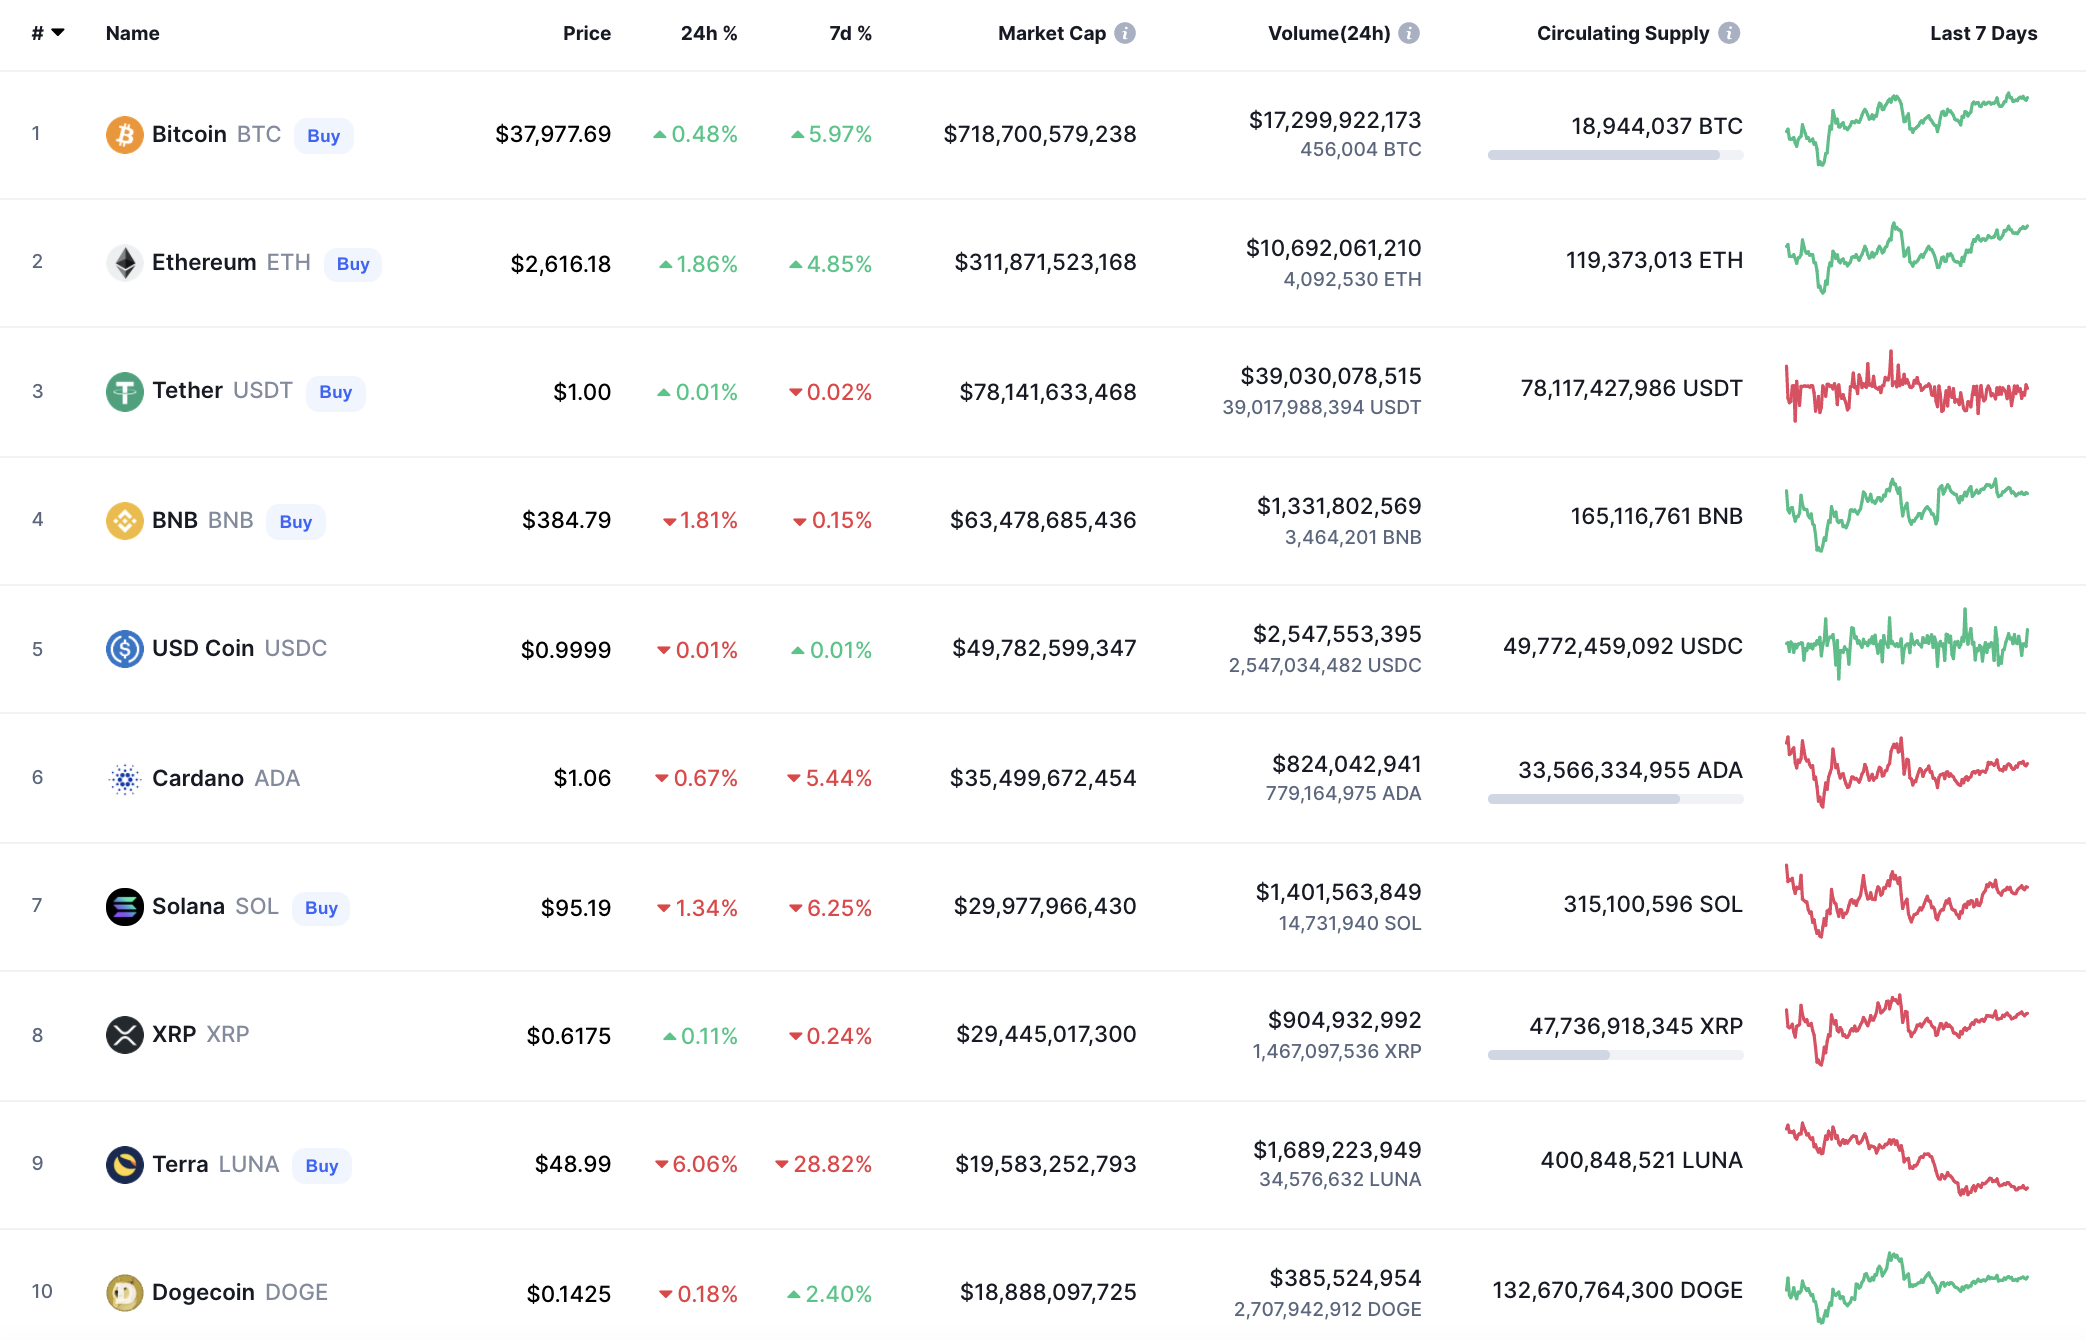
While altcoins are going down, the rate of Bitcoin (BTC) has increased by 0.48% since yesterday.
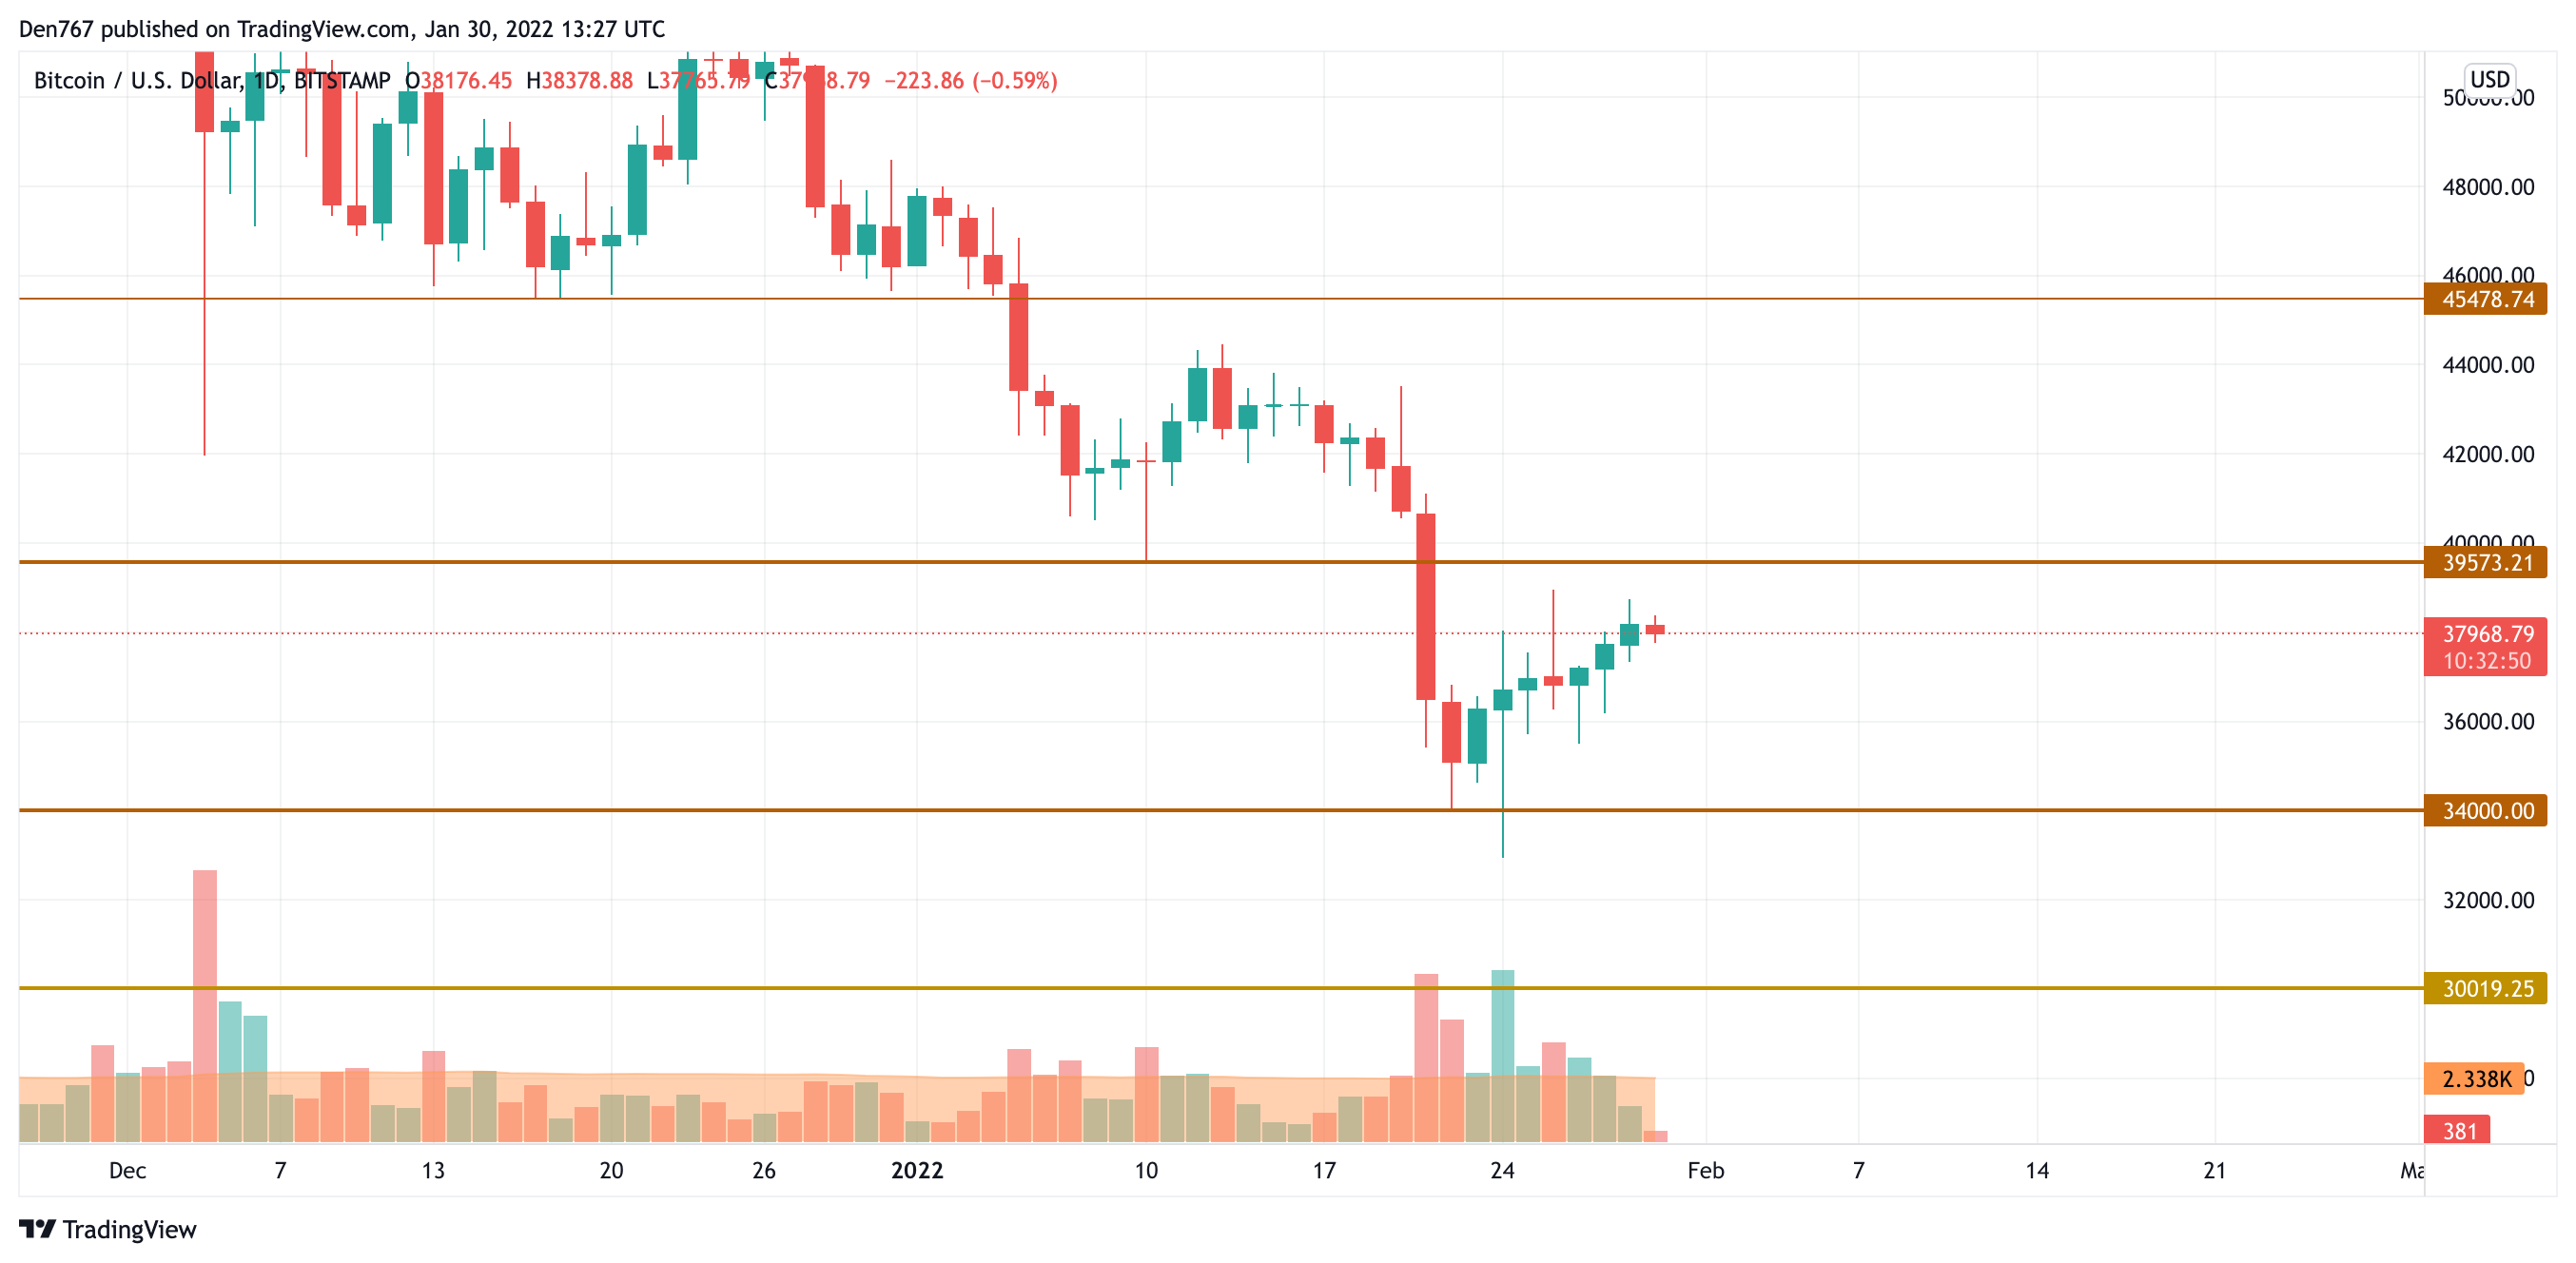
On the daily chart, Bitcoin (BTC) is coming closer to the resistance level at $39,573. If buyers can break it and fix above, the correction can be transformed to mid-term growth. Such a price action is relevant until mid-February.
Bitcoin is trading at $37,997 at press time.
SOL/USD
Solana (SOL) could not follow the rise of Bitcoin (BTC), going down by 2.12%.
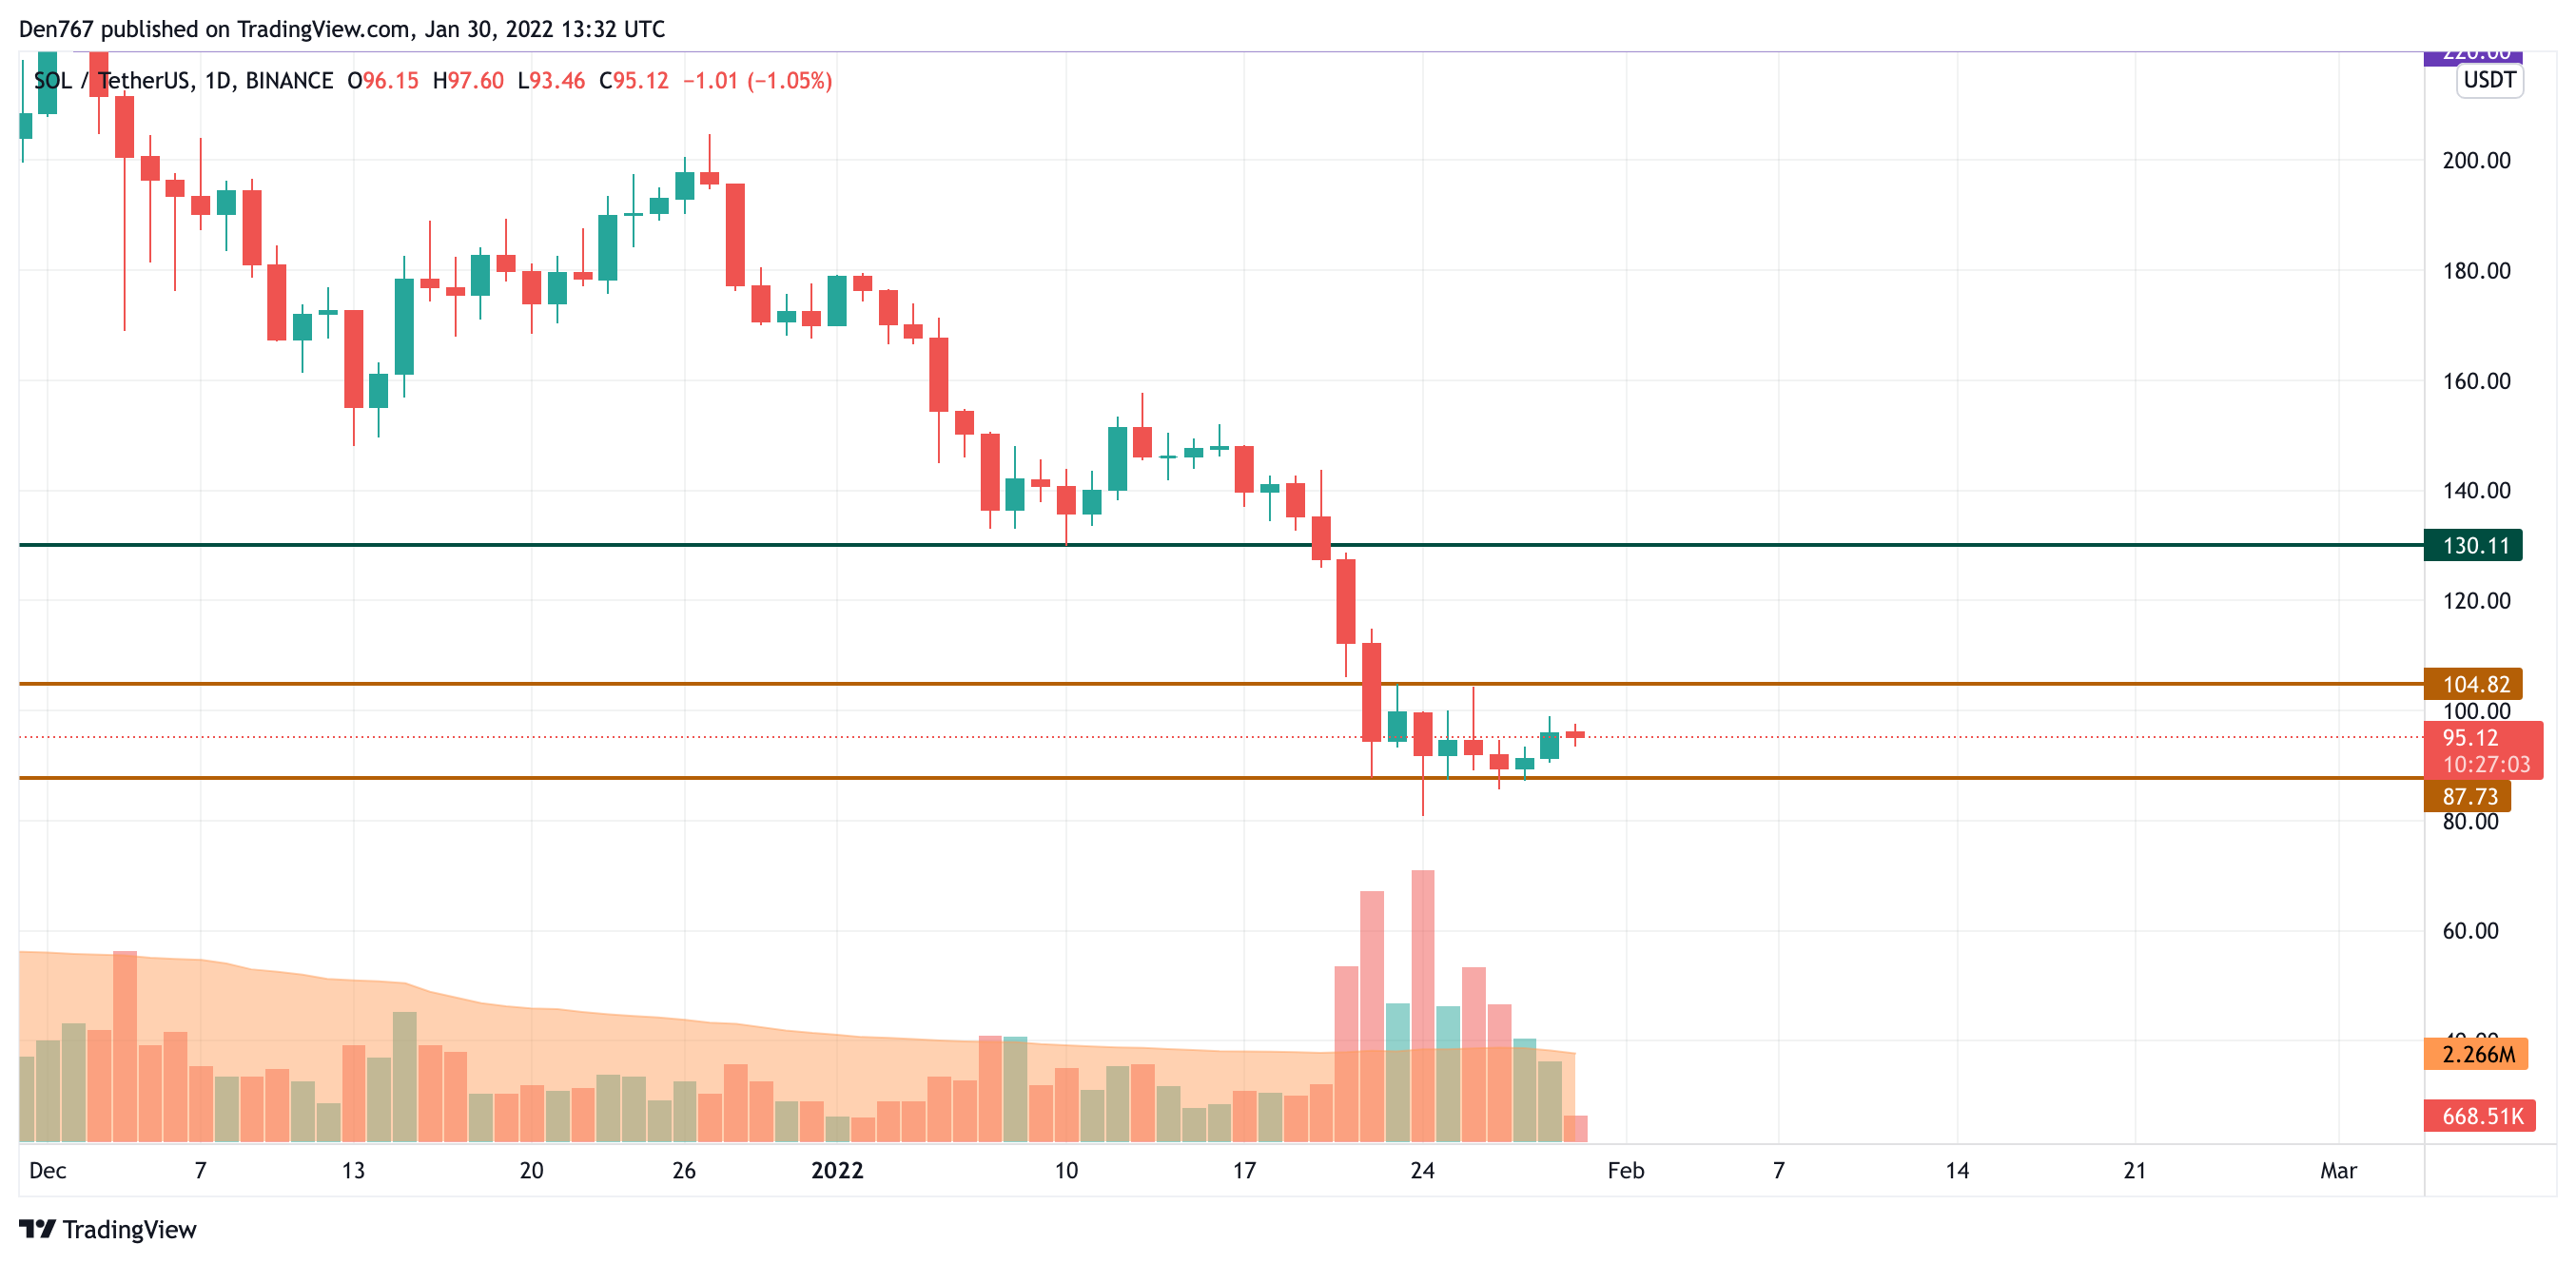
After SOL bounced off the support level at $87.73, the price keeps trading sideways, accumulating power for a further sharp move.
In this case, one needs to pay close attention to the level at $104.82—the potential breakout of which might be a prerequisite for continued growth.
SOL is trading at $94.83 at press time.
LUNA/USD
LUNA is the biggest loser from the list, going down by 7.43%.
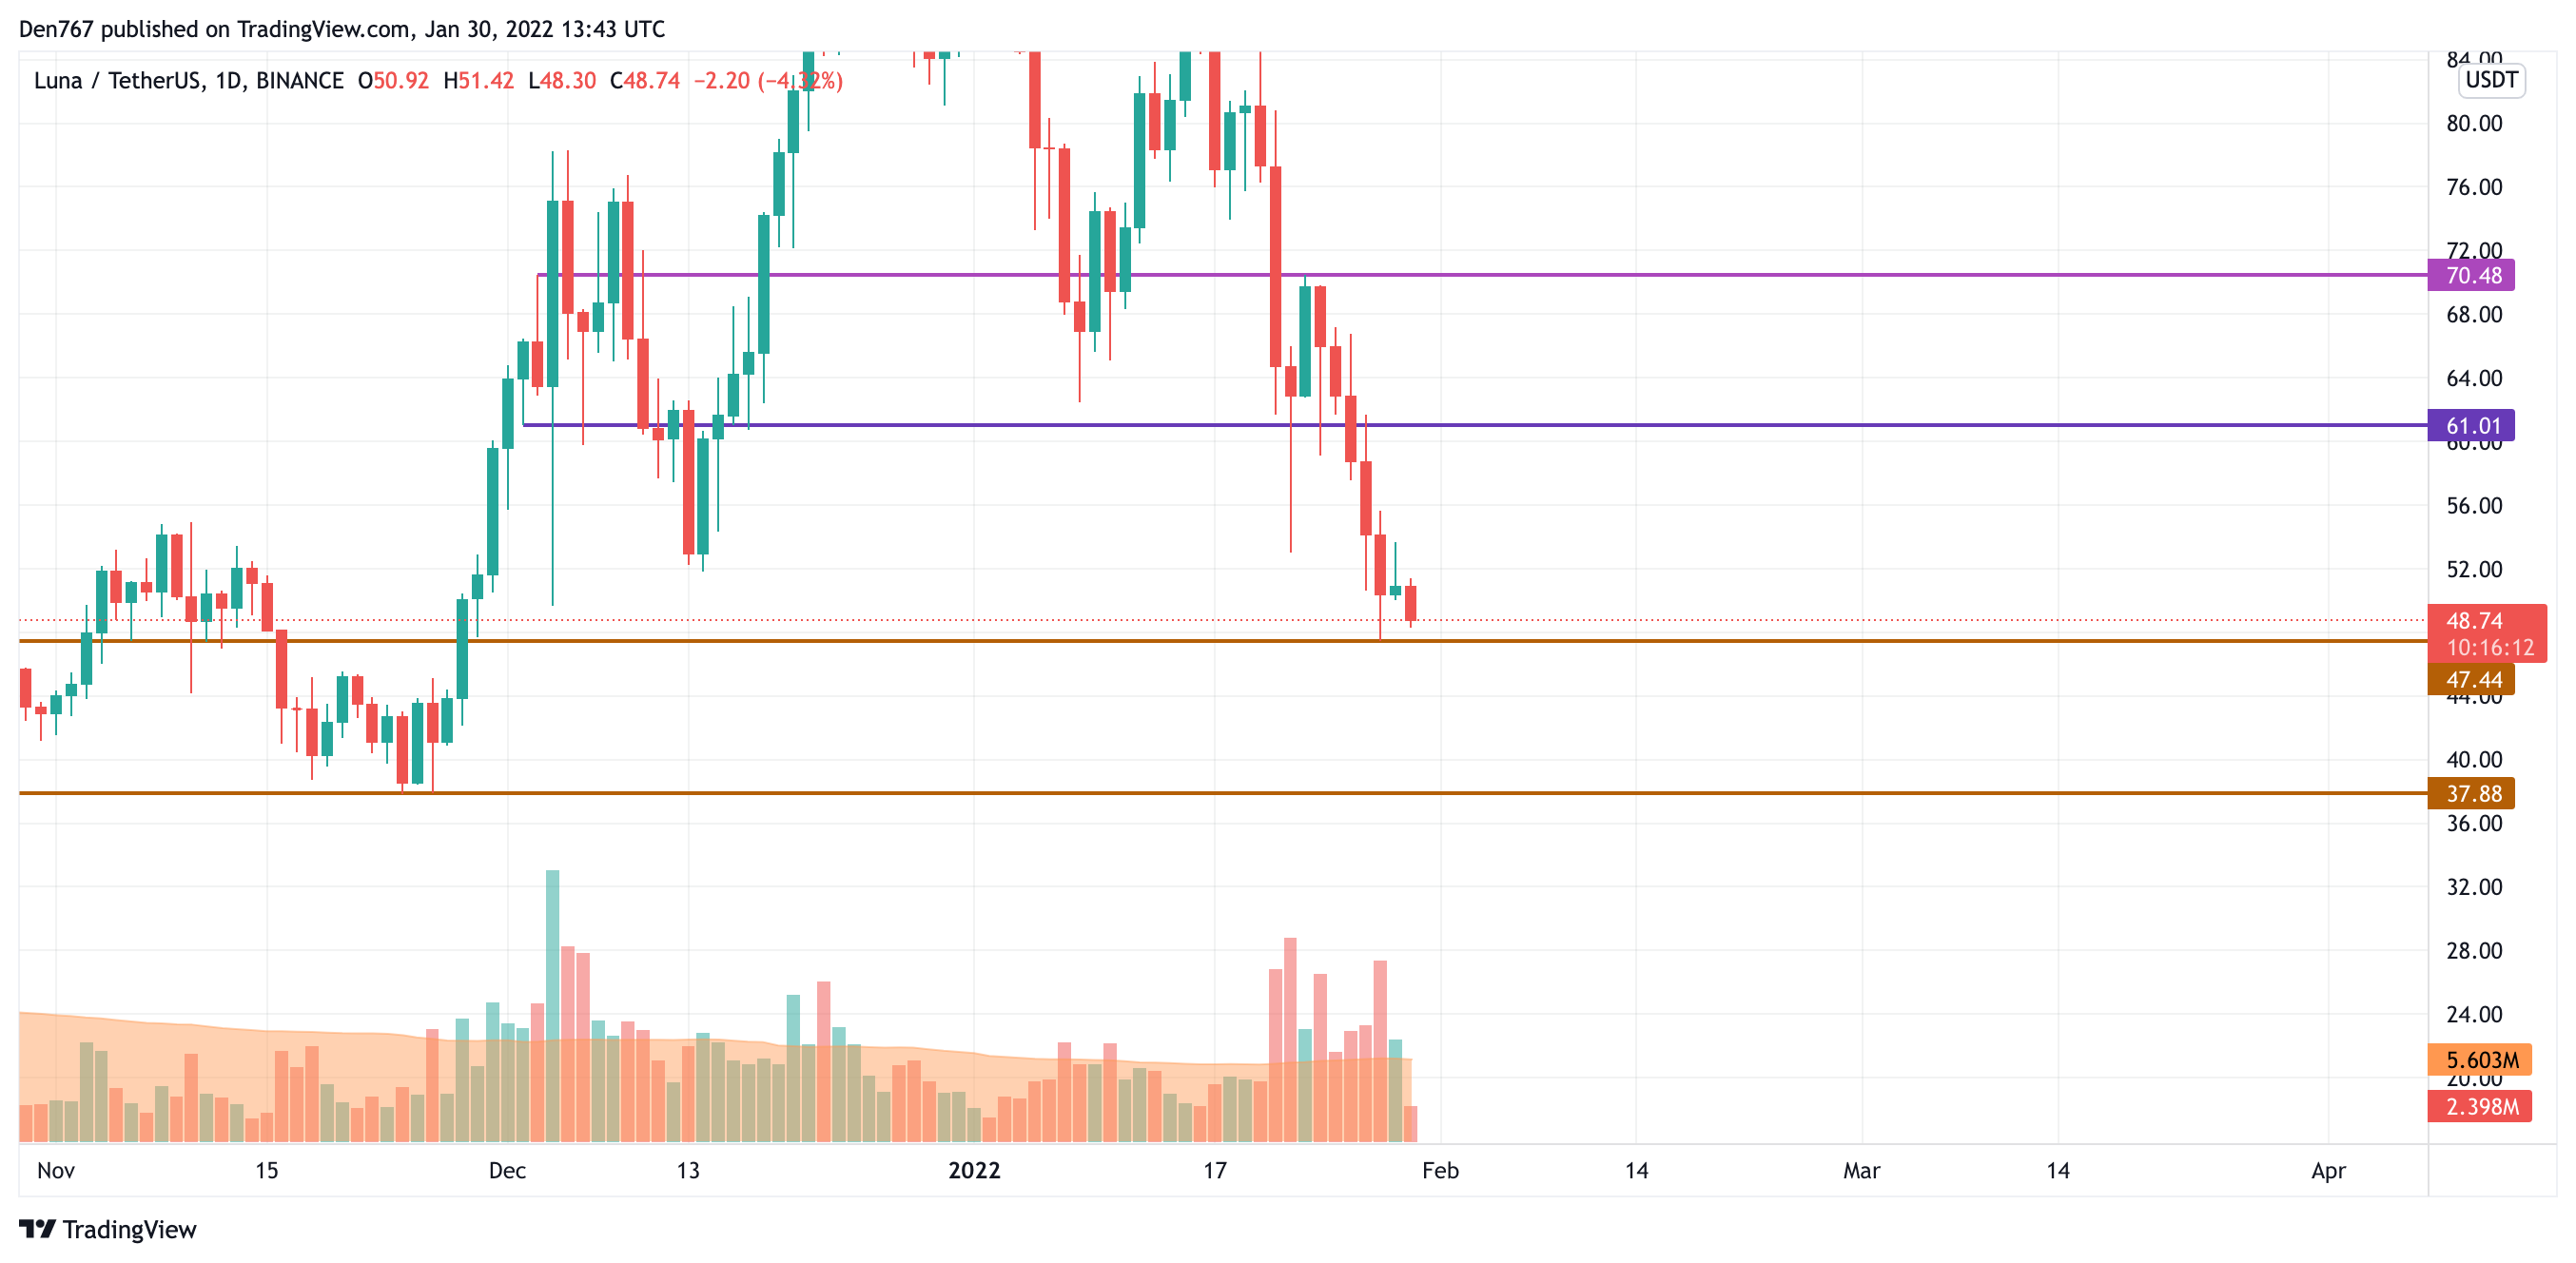
LUNA is looking much worse compared to other altcoins. The price is coming back to the recently tested support level at $47.44 on the daily timeframe. If bears manage to break it, the fall may continue to the next level at $37.88 within the next few days.
LUNA is trading at $48.74 at press time.
DOGE/USD
The rate of DOGE is almost unchanged since yesterday, with a fall accounting for only 0.53%.
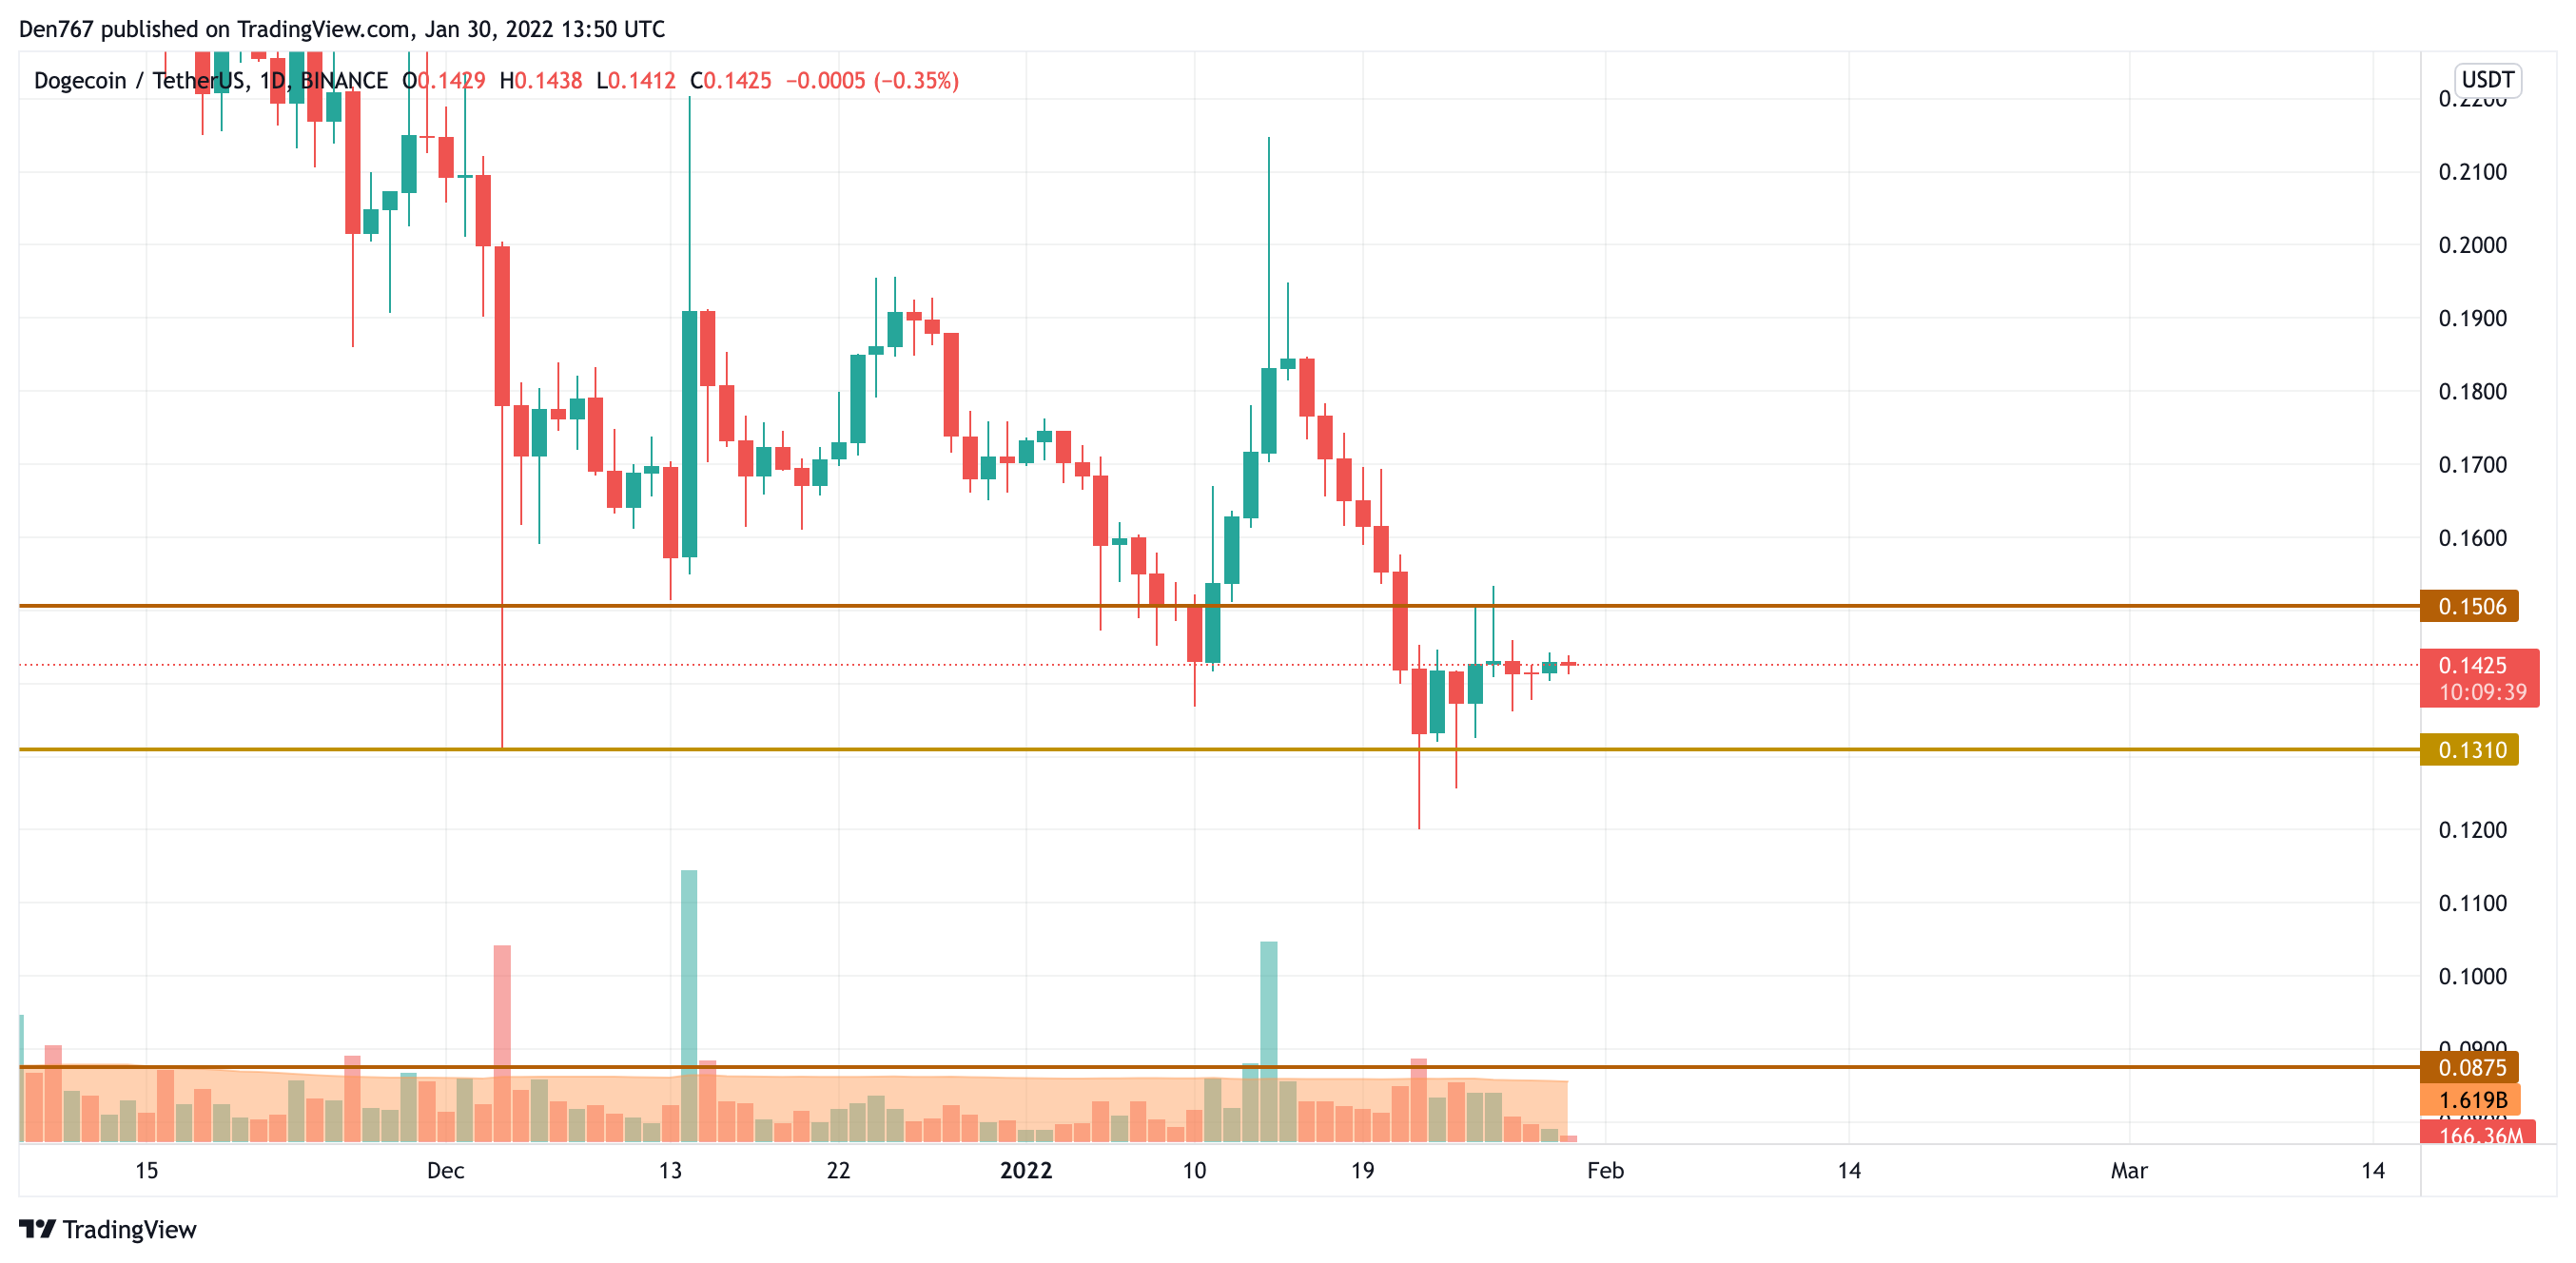
Despite the fall, DOGE is trading sideways as the rate is located between the support at $0.1310 and the resistance at $0.1506.
At the moment, the price is closer to the resistance, which means that bulls are more powerful than bears to a certain extent. In this regard, if buyers fix above the $0.15 zone, the rise may continue to $0.16 shortly.
DOGE is trading at $0.1425 at press time.
AVAX/USD
Avalanche (AVAX) is not an exception to the rule, declining by 1.17%.
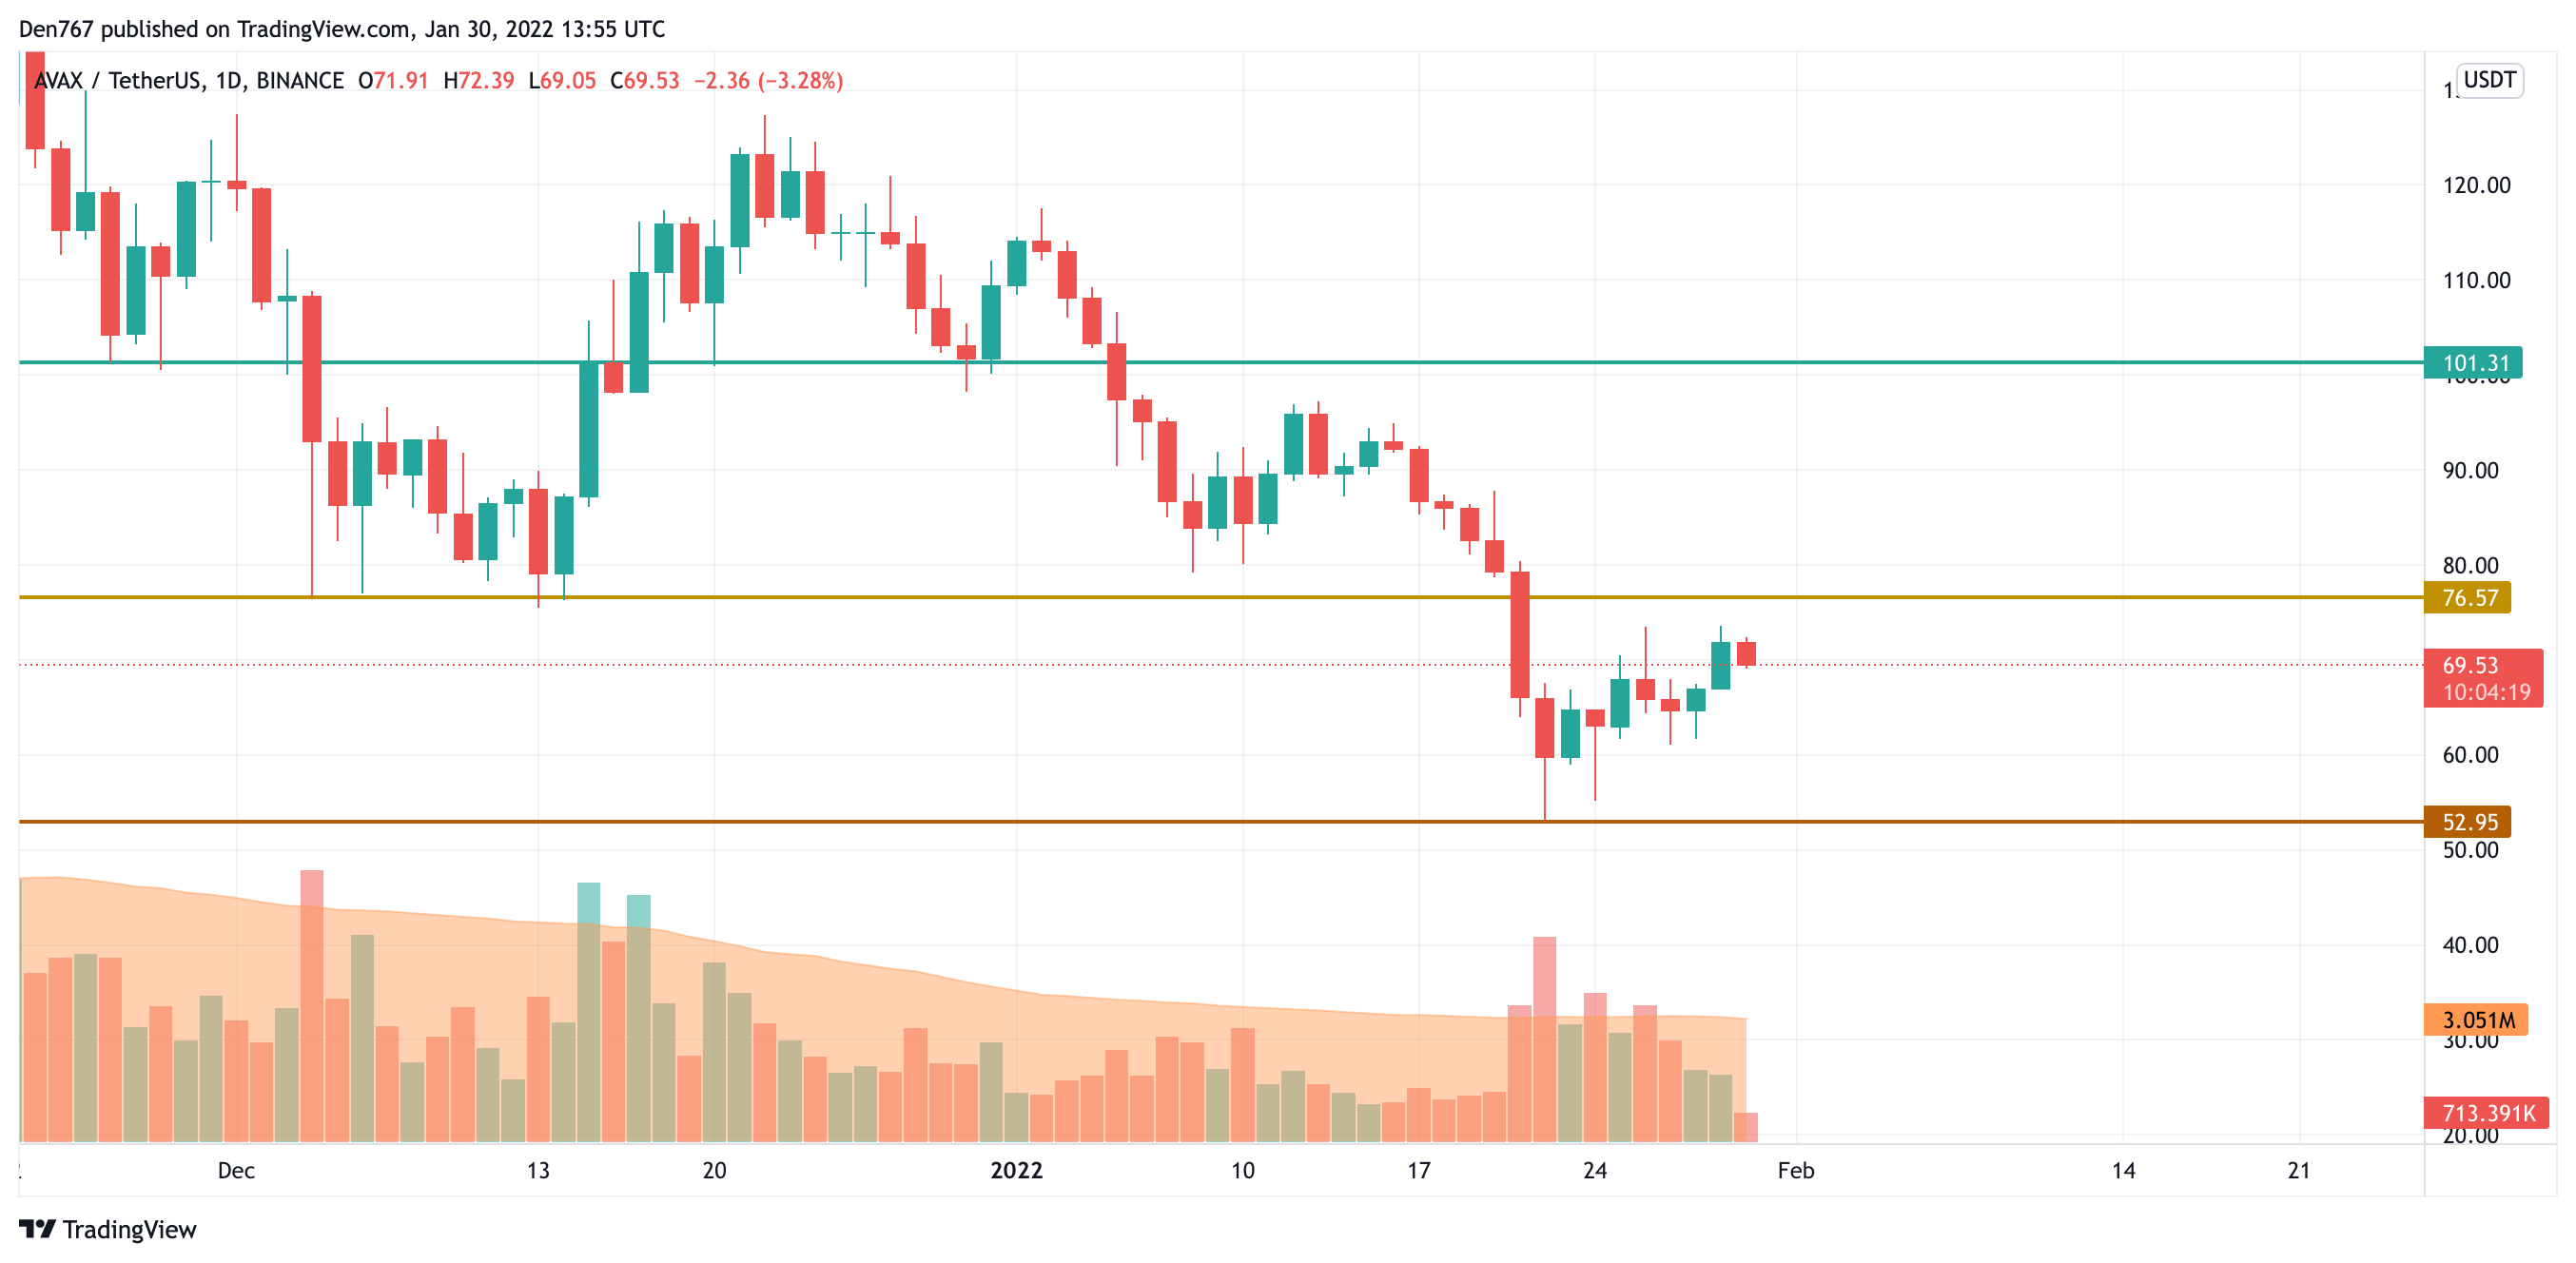
AVAX is located closer to the resistance level at $76.57. The selling volume has declined, which means that bears are losing their initiative. If buyers can take this chance and return the rate above $80, AVAX can come back to the mid-term bullish trend.
AVAX is trading at $69.50 at press time.