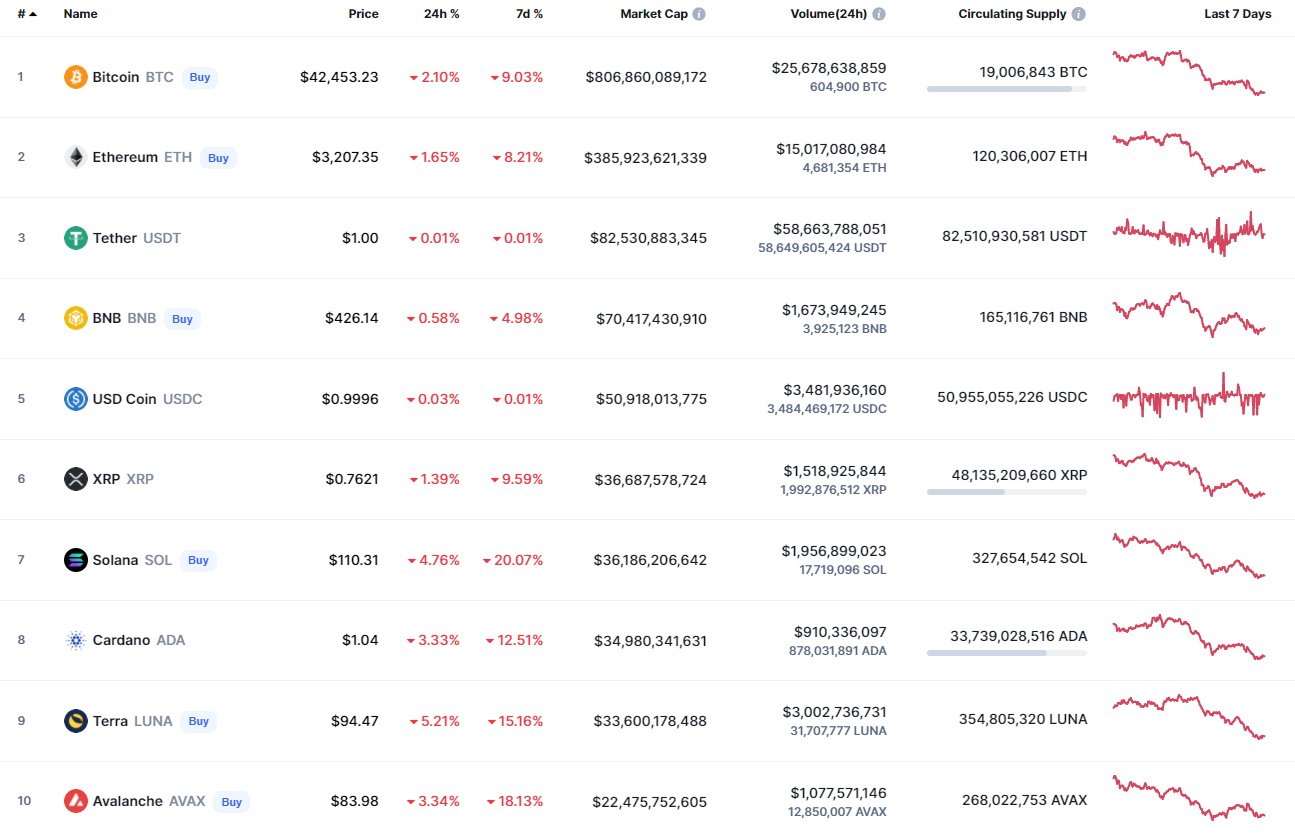
The weekend has begun with the fall of the cryptocurrency market as all of the coins are in the red zone.
BTC/USD
Bitcoin (BTC) has gone down by 2% over the last 24 hours.
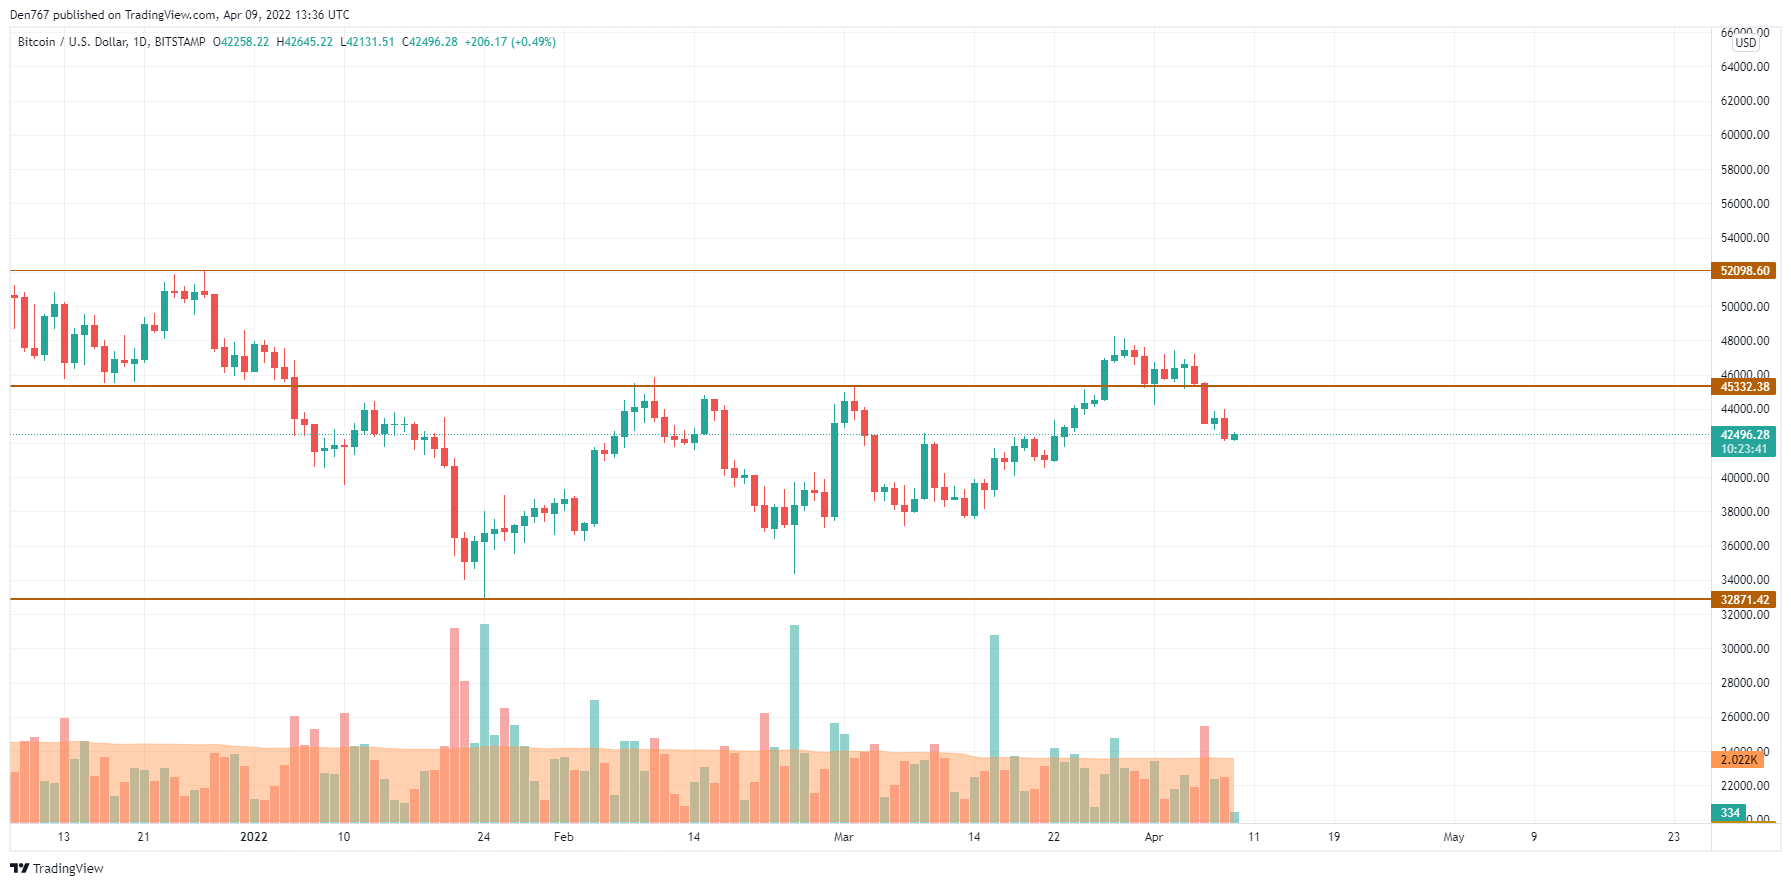
Bitcoin (BTC) has bounced off the $42,000 mark, which means that bulls are not going to give up. The rate is closer to the resistance level than to the middle of the wide channel that also confirms buyers’ power. In this case, if the price returns to the $44,000 mark, one can expect the test of the area around $45,000 next week.
Bitcoin is trading at $42,517 at press time.
ETH/USD
Ethereum (ETH) has lost less than Bitcoin (BTC) with a drop of 1.29%.
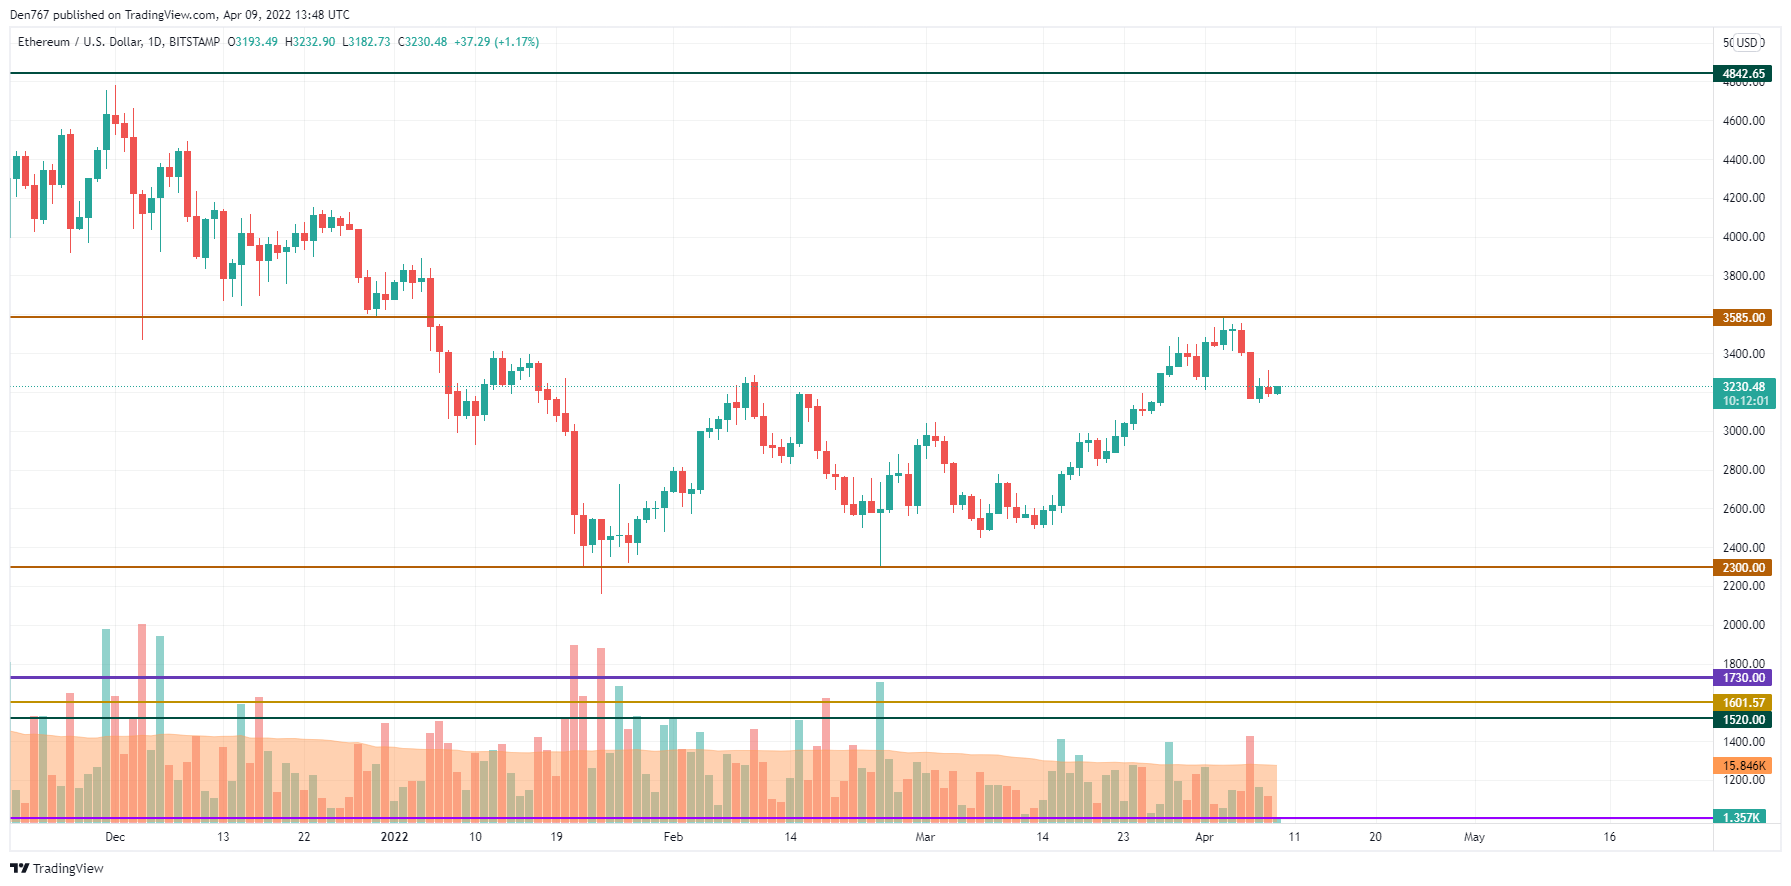
Ethereum (ETH) is trading similarly to Bitcoin (BTC) as its rate is also located near the resistance level. The selling volume is going down, which means that there is a greater chance to see growth than decline. All in all, one can expect a slow rise to $3,400-$3,500 within the next few days.
Ethereum is trading at $3,228 at press time.
ADA/USD
Cardano (ADA) is not an exception to the rule, declining by 3.32% over the last day.
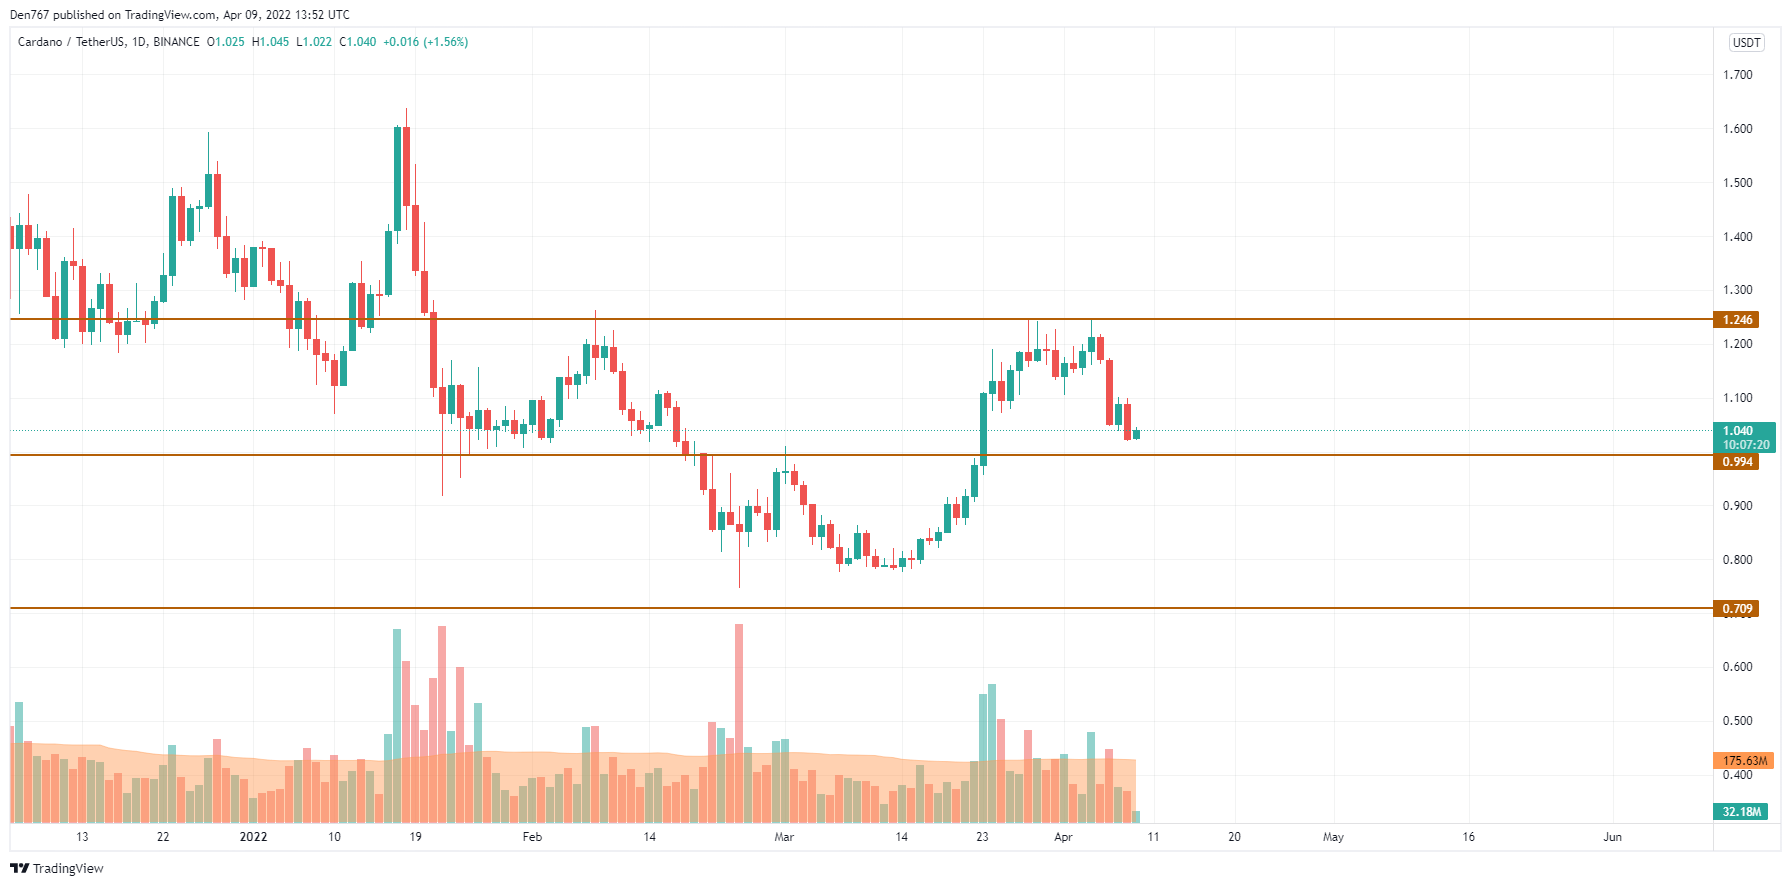
Despite the fall, Cardano (ADA) is located near the vital level at $0.994. If the sellers’ pressure continues, there is a high possibility to see a breakout, followed by a further price decrease. However, if bulls can hold the $1 mark, the rise may lead to the test of $1.10 shortly.
ADA is trading at $1.036 at press time.
BNB/USD
The rate of Binance Coin (BNB) is almost unchanged since yesterday.
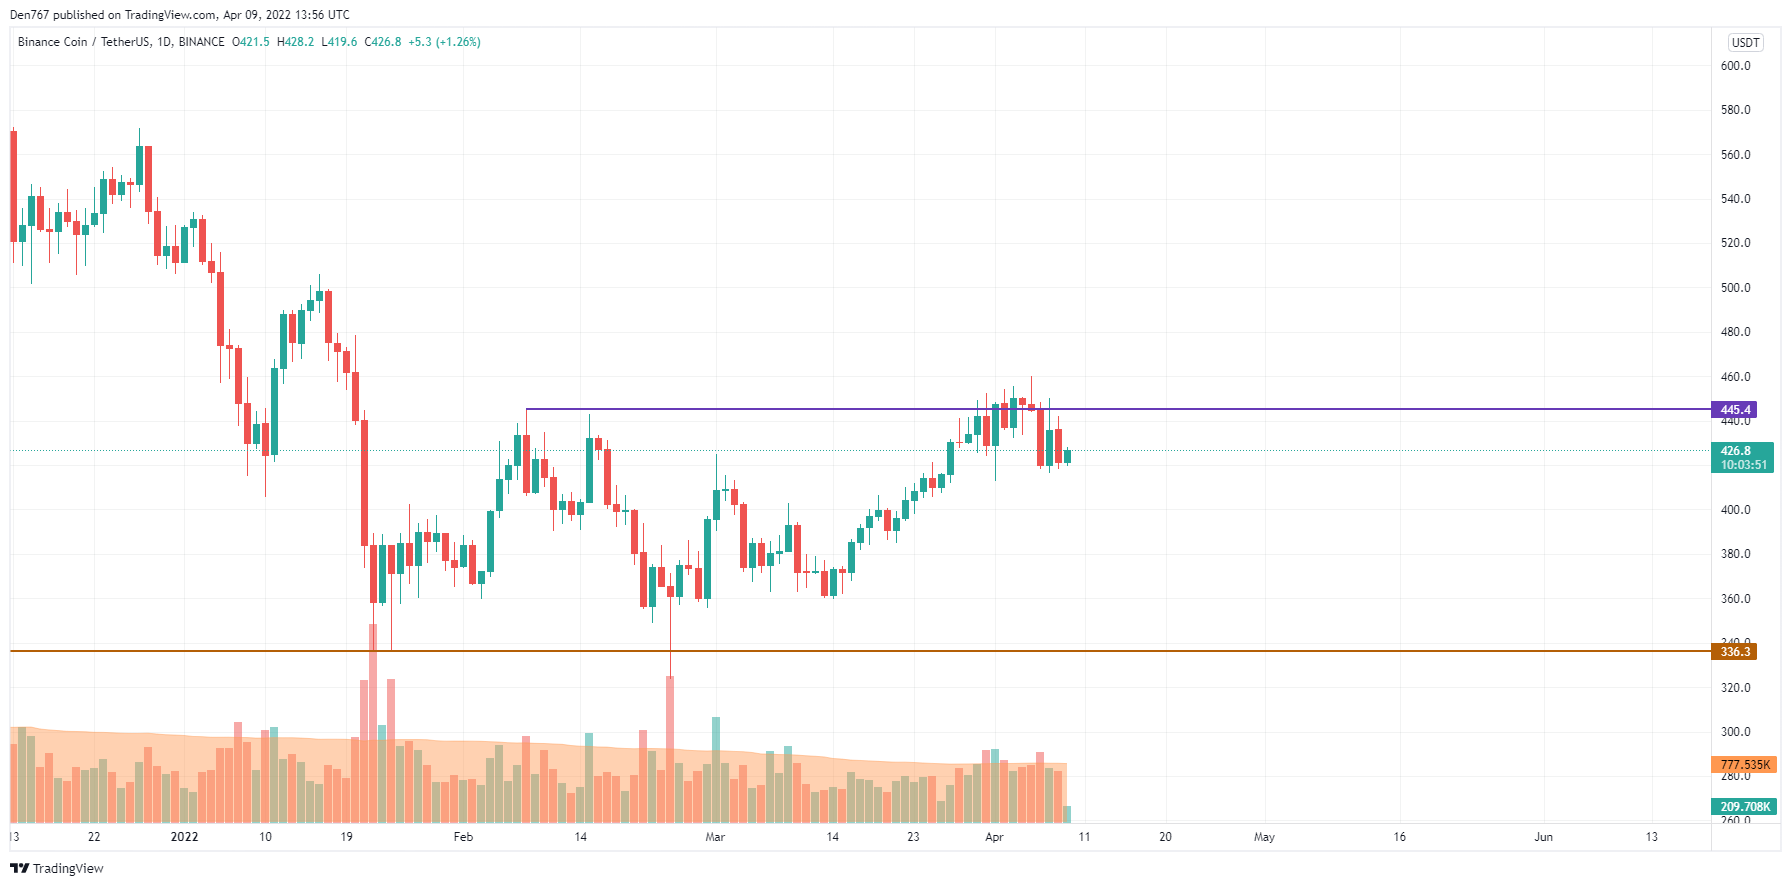
Binance Coin (BNB) is looking worse than other coins as the rate is located below the $445 level. Thus, the selling trading volume remains high, which means that there is a high chance to see a further drop. If that happens, the price of the native exchange coin can come back to the psychological mark of $400.
BNB is trading at $426 at press time.
SOL/USD
Solana (SOL) is the biggest loser from the list today, falling by 4.25%.
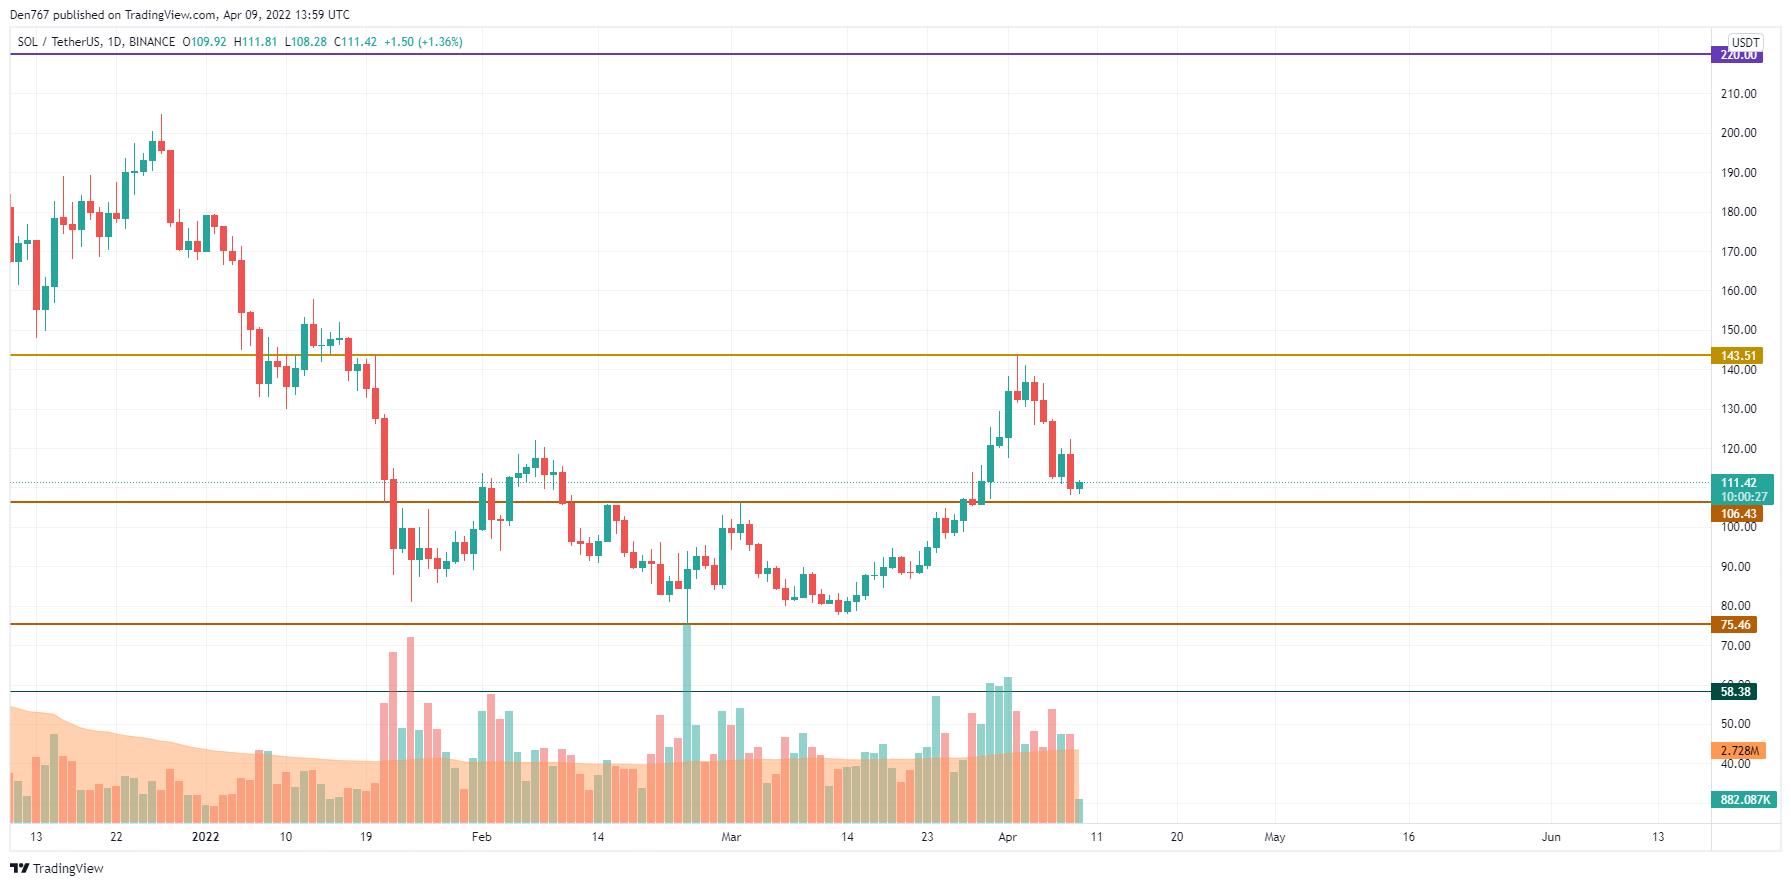
From the technical point of view, Solana (SOL) is trading near the support level at $106 against the increased volume. If buyers cannot seize the initiative, the breakout may lead to the drop below the vital $100 mark.
SOL is trading at $111.50 at press time.

