

Have the coins reached their local supports so far for a reversal?
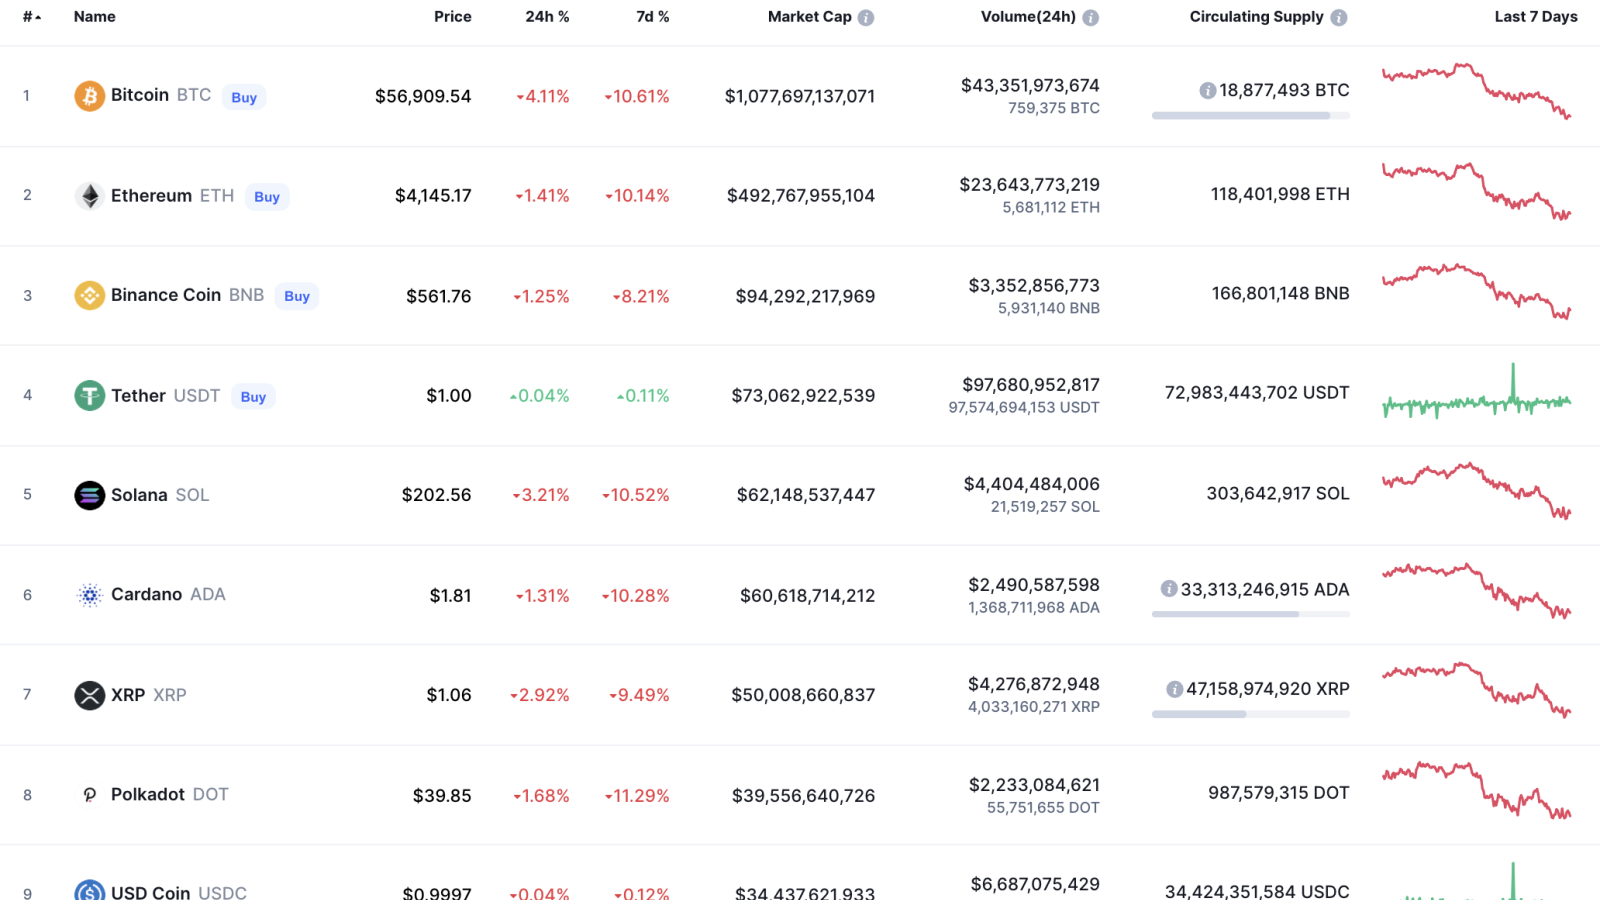
The cryptocurrency market remains in the red zone after yesterday’s sharp decline.
BTC/USD
Yesterday, bearish pressure intensified and the Bitcoin price rolled back to the support of $58,000. Sales volumes were quite large, and the bears managed to push through this support, setting another minimum at the point of $56,565.
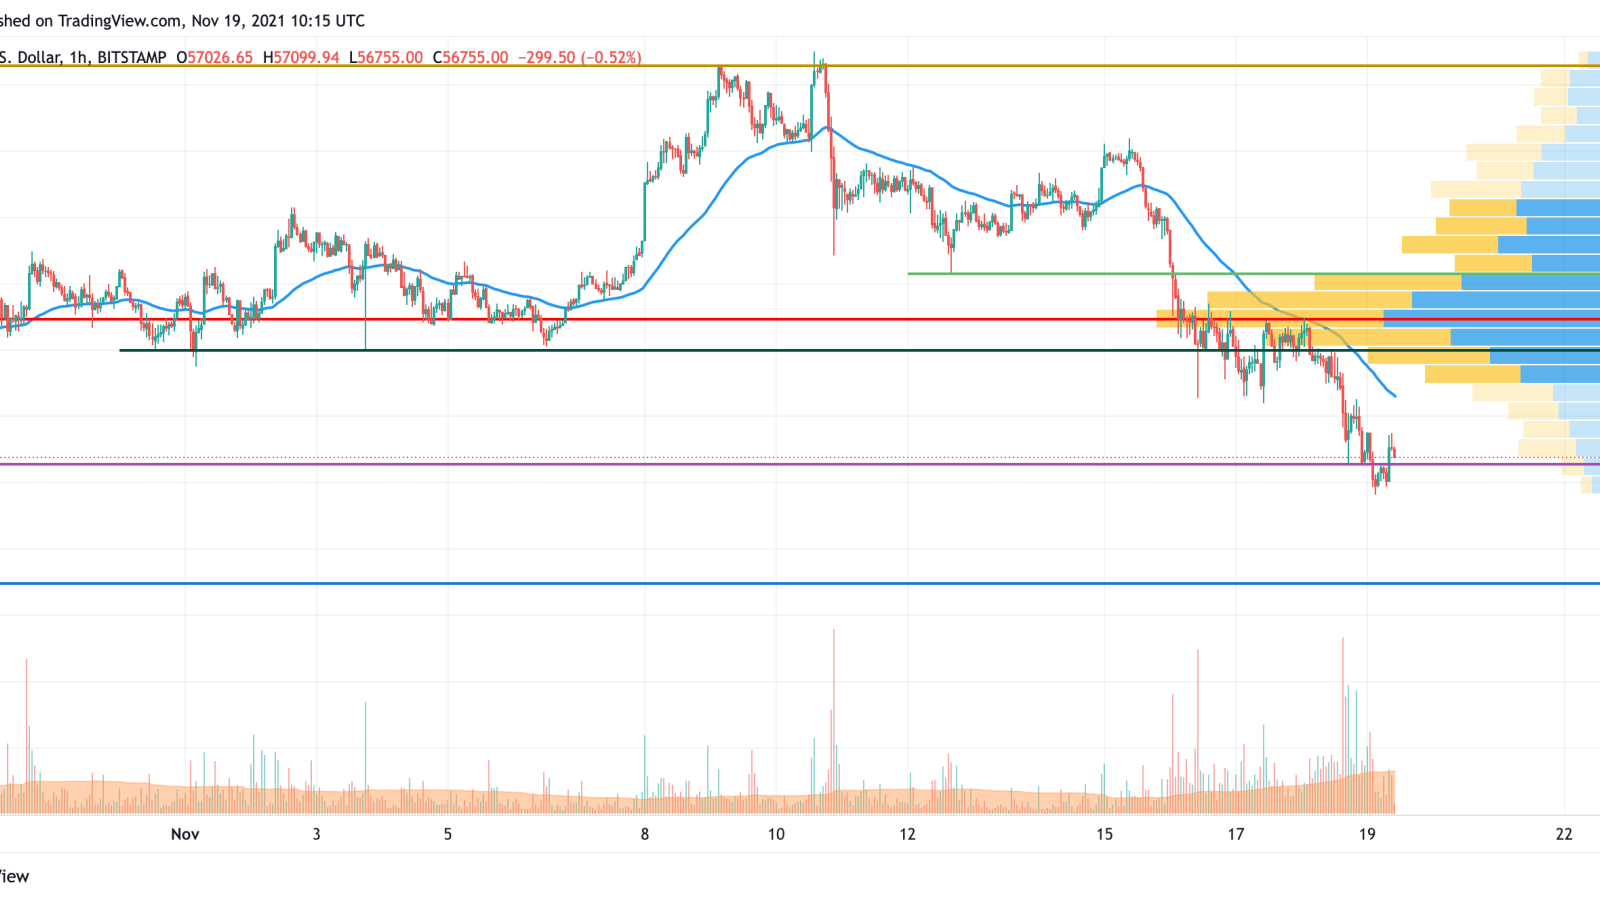
By the end of the day, it did not work to recover above the $58,000 mark, and tonight the decline continued to the $55,287 level.
In the morning, trading volumes decreased and the BTC price had not yet had time to test the support of 78.6% Fibonacci. This level may be able to reverse the pair to the recovery, which can allow the return to the support of $58,000. If the pair fails to consolidate above this key support by the end of the week, then the local downtrend has not yet ended.
Bitcoin is trading at $56,861 at press time.
XRP/USD
Yesterday, the XRP price pulled back to the $1 level per coin, setting the daily low at $1.016.
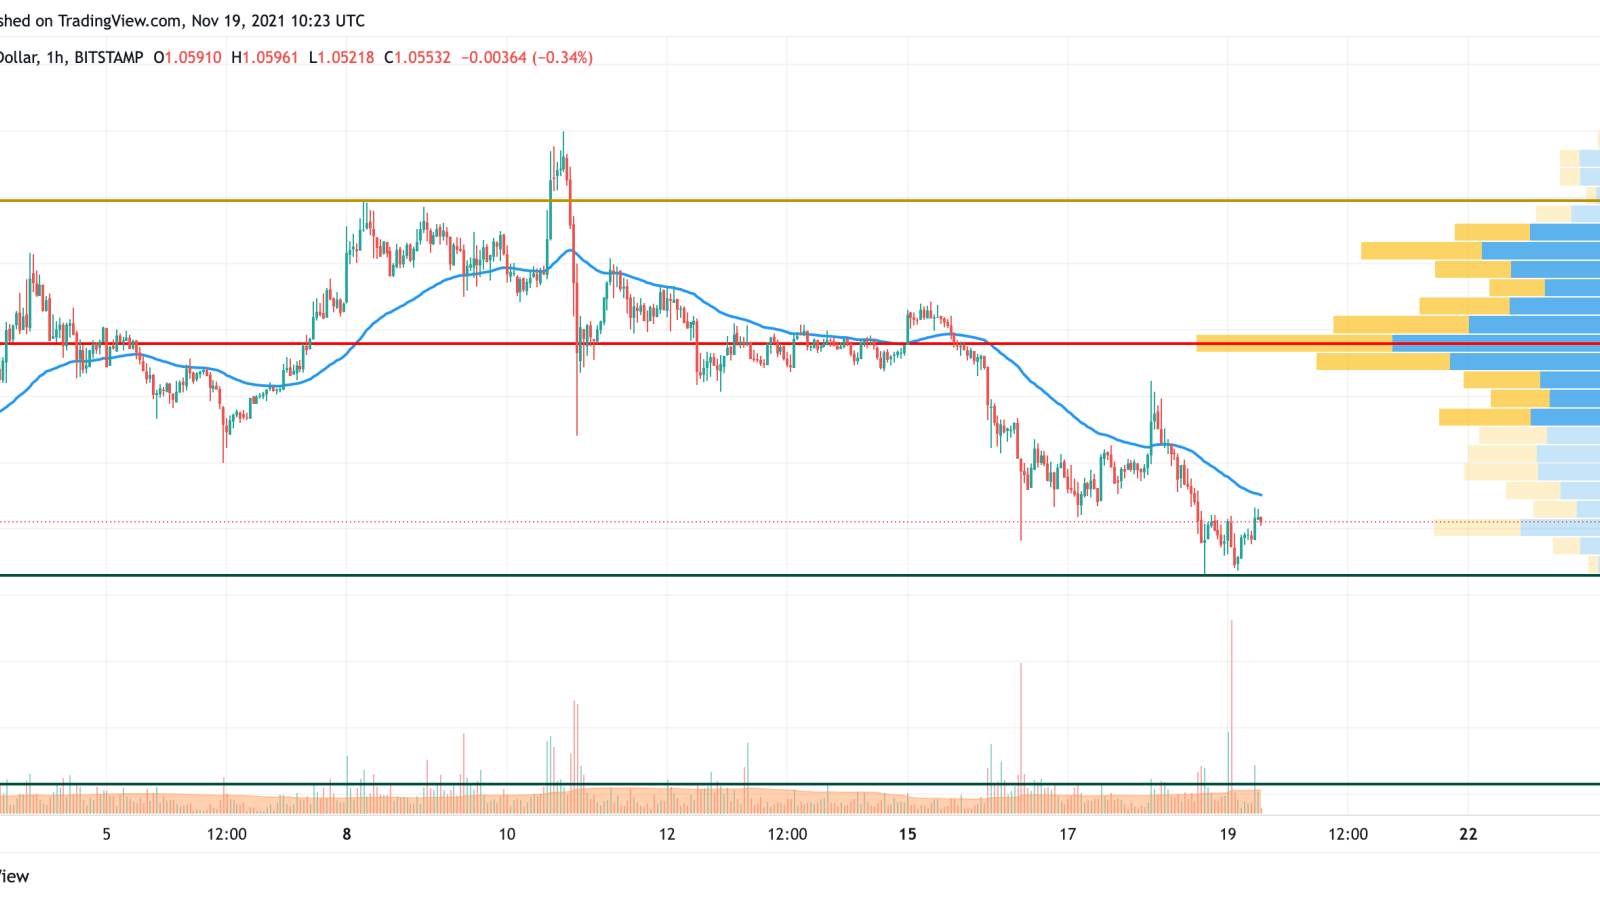
Over the past night, buyers did not manage to significantly restore the price. Perhaps this morning, they can make another attempt to return to the average price area.
The attempt will be considered successful if the price consolidates above the support of $1.10. Otherwise, the bears might push the psychological level of $1.
XRP is trading at $1.0553 at press time.
DOGE/USD
The rate of DOGE has gone down by 2.40% over the last 24 hours.
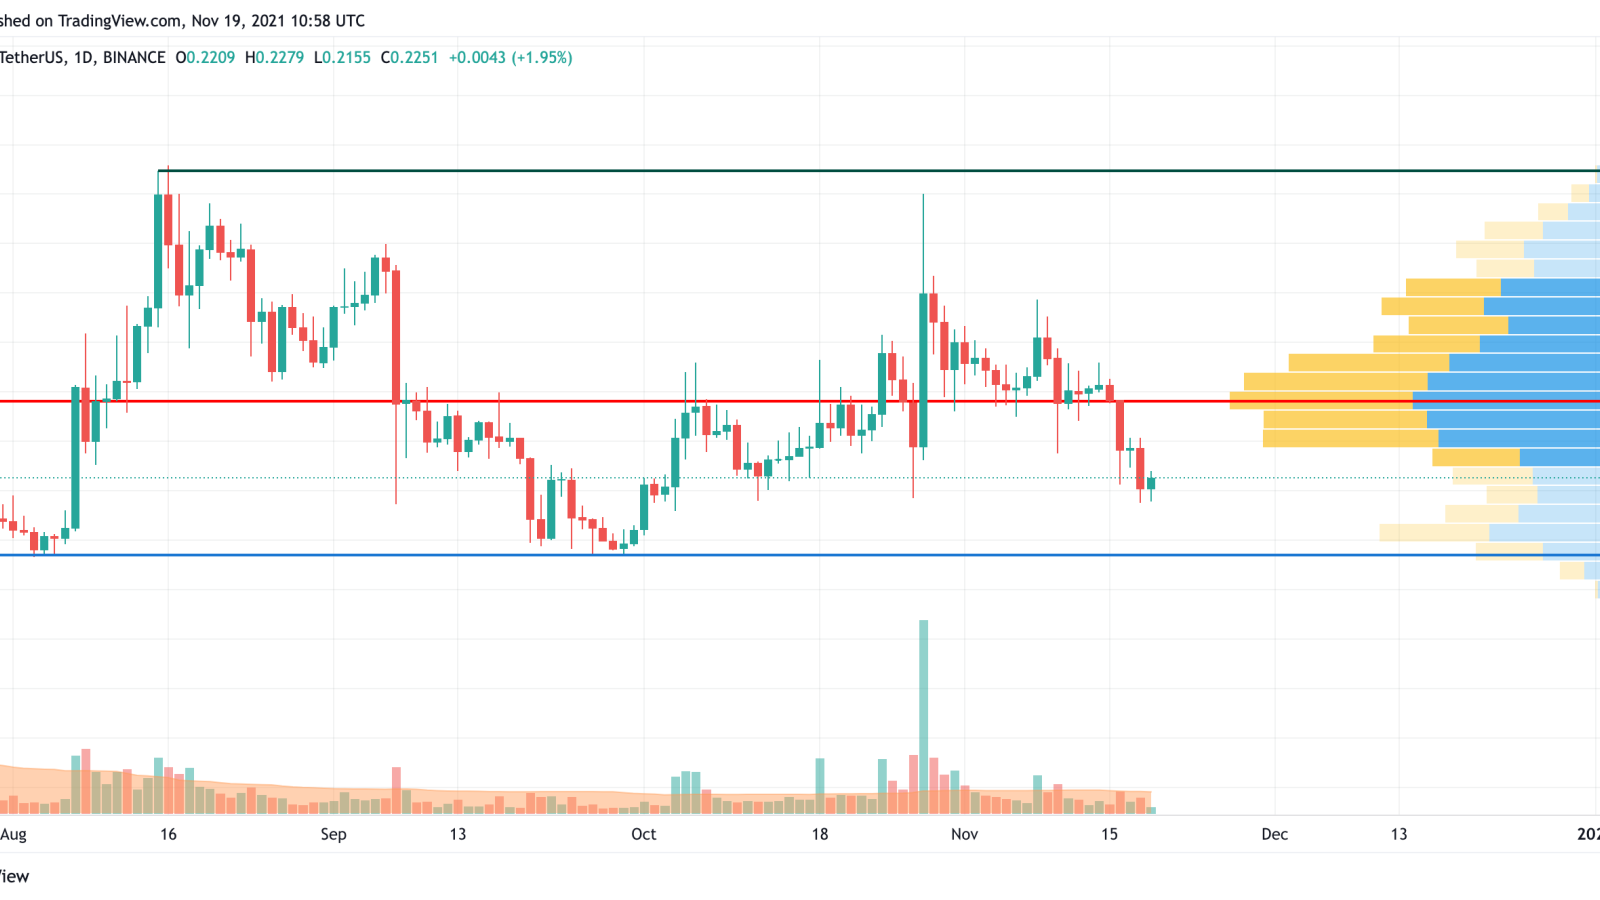
DOGE is bouncing back after a drop; however, the fall may not have ended yet. At the moment, the meme coin is trading within a wide channel with no bearish or bullish signals. If sellers keep pushing the price up, there is a chance to see the test of the area around $0.1940 soon.
DOGE is trading at $0.2251 at press time.
SHIB/USD
SHIB is the biggest loser from the list, falling by almost 6% since yesterday.
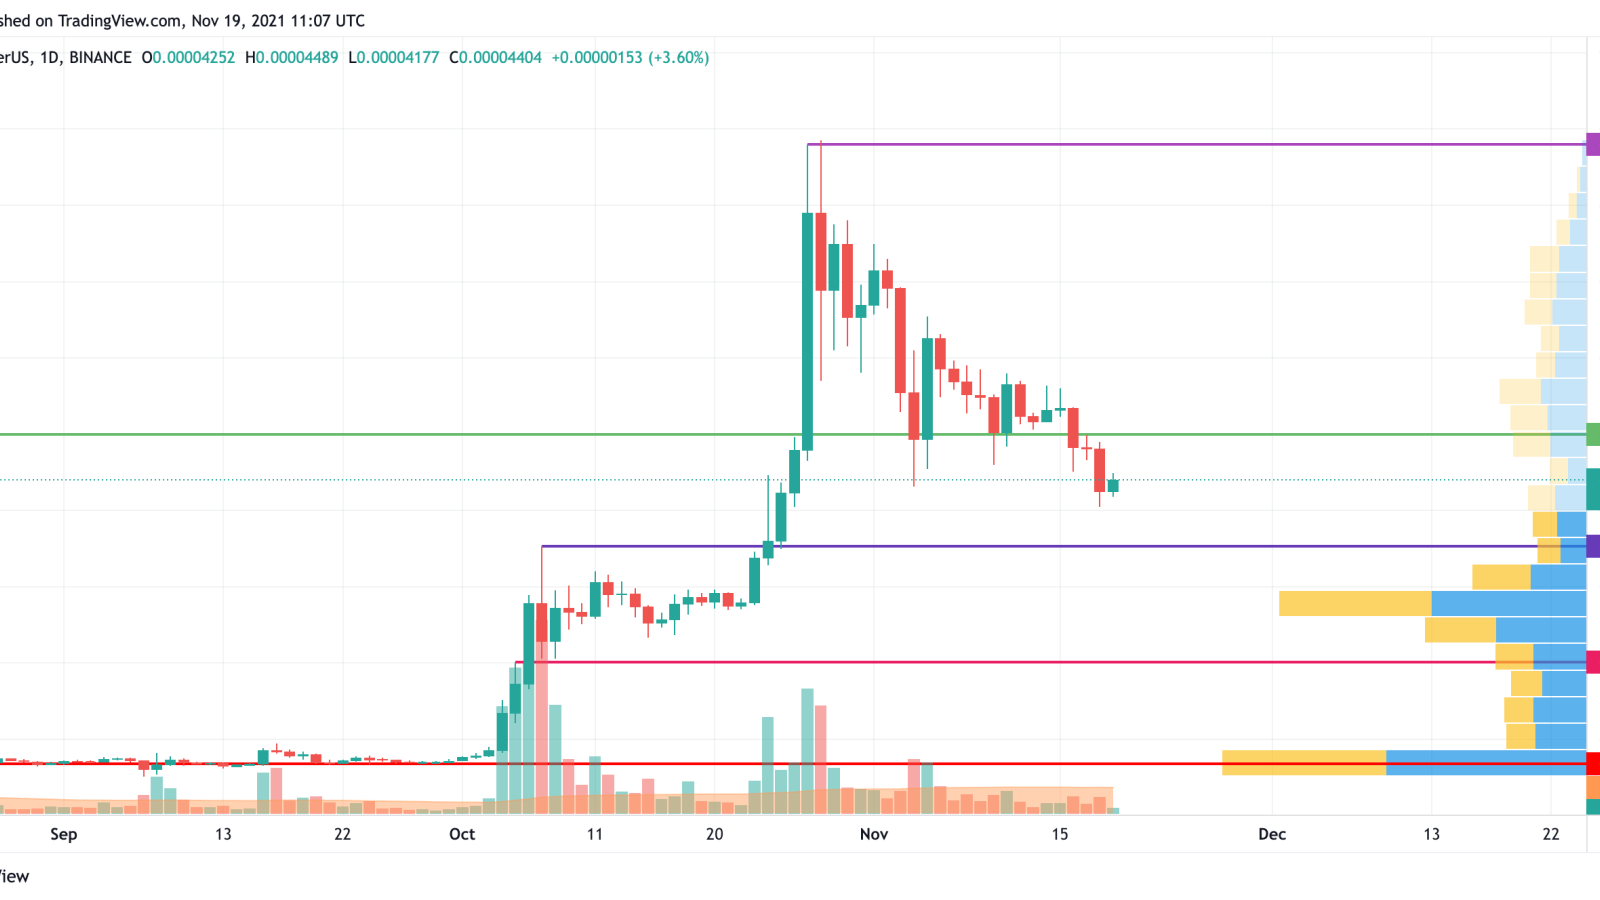
SHIB broke the support at $0.000050 and fixed below it. Currently, bears are more powerful than bulls, which is also confirmed by the low buying trading volume. Buyers should come back above the green line to seize the initiative, or the decline may continue to the purple zone at $0.00003528.
SHIB is trading at $0.00004397 at press time.