

Have the main cryptocurrencies already found their support levels?
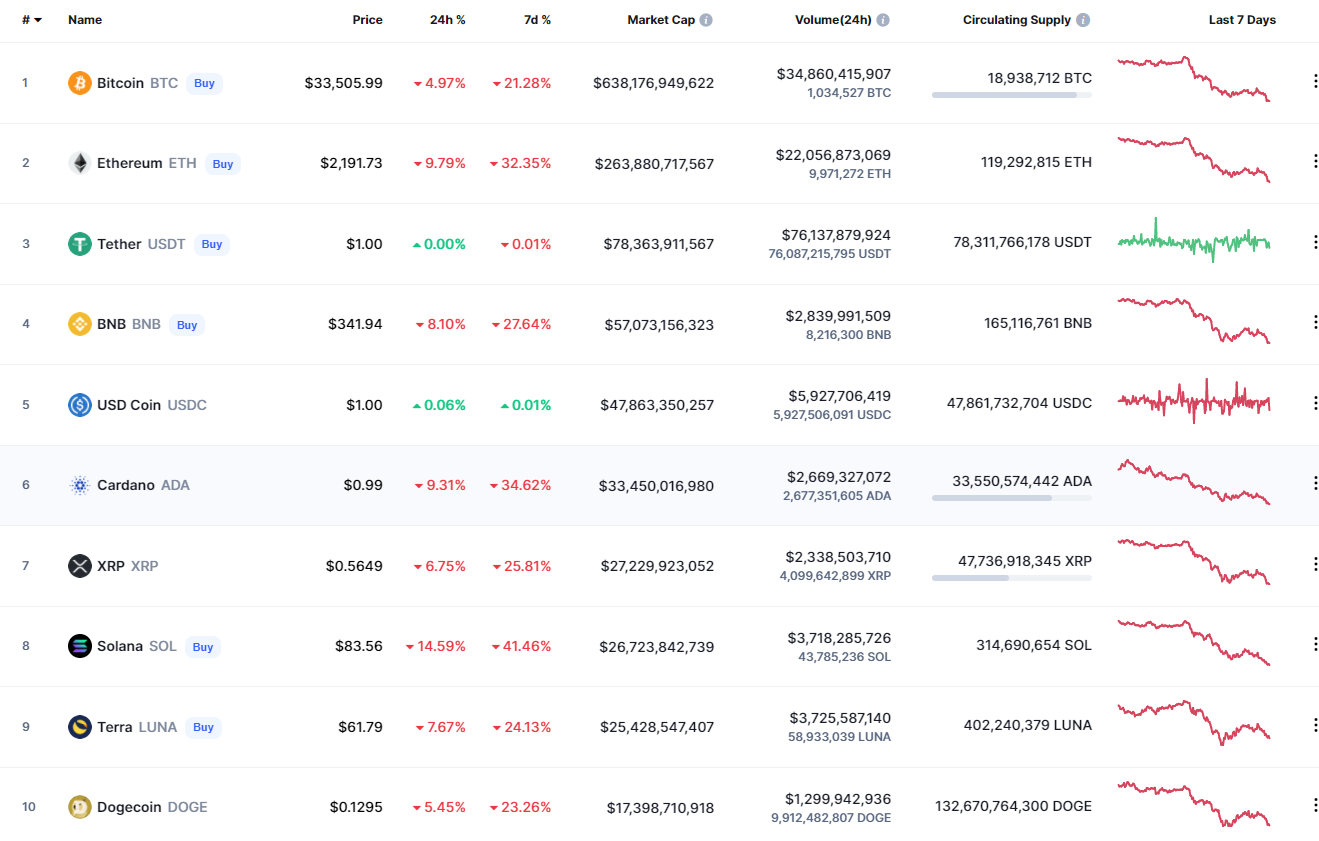
A new week has started with another cryptocurrency market correction, with all the top 10 coins being in the red zone.
BTC/USD
The price of Bitcoin (BTC) has gone down by 5.14%.
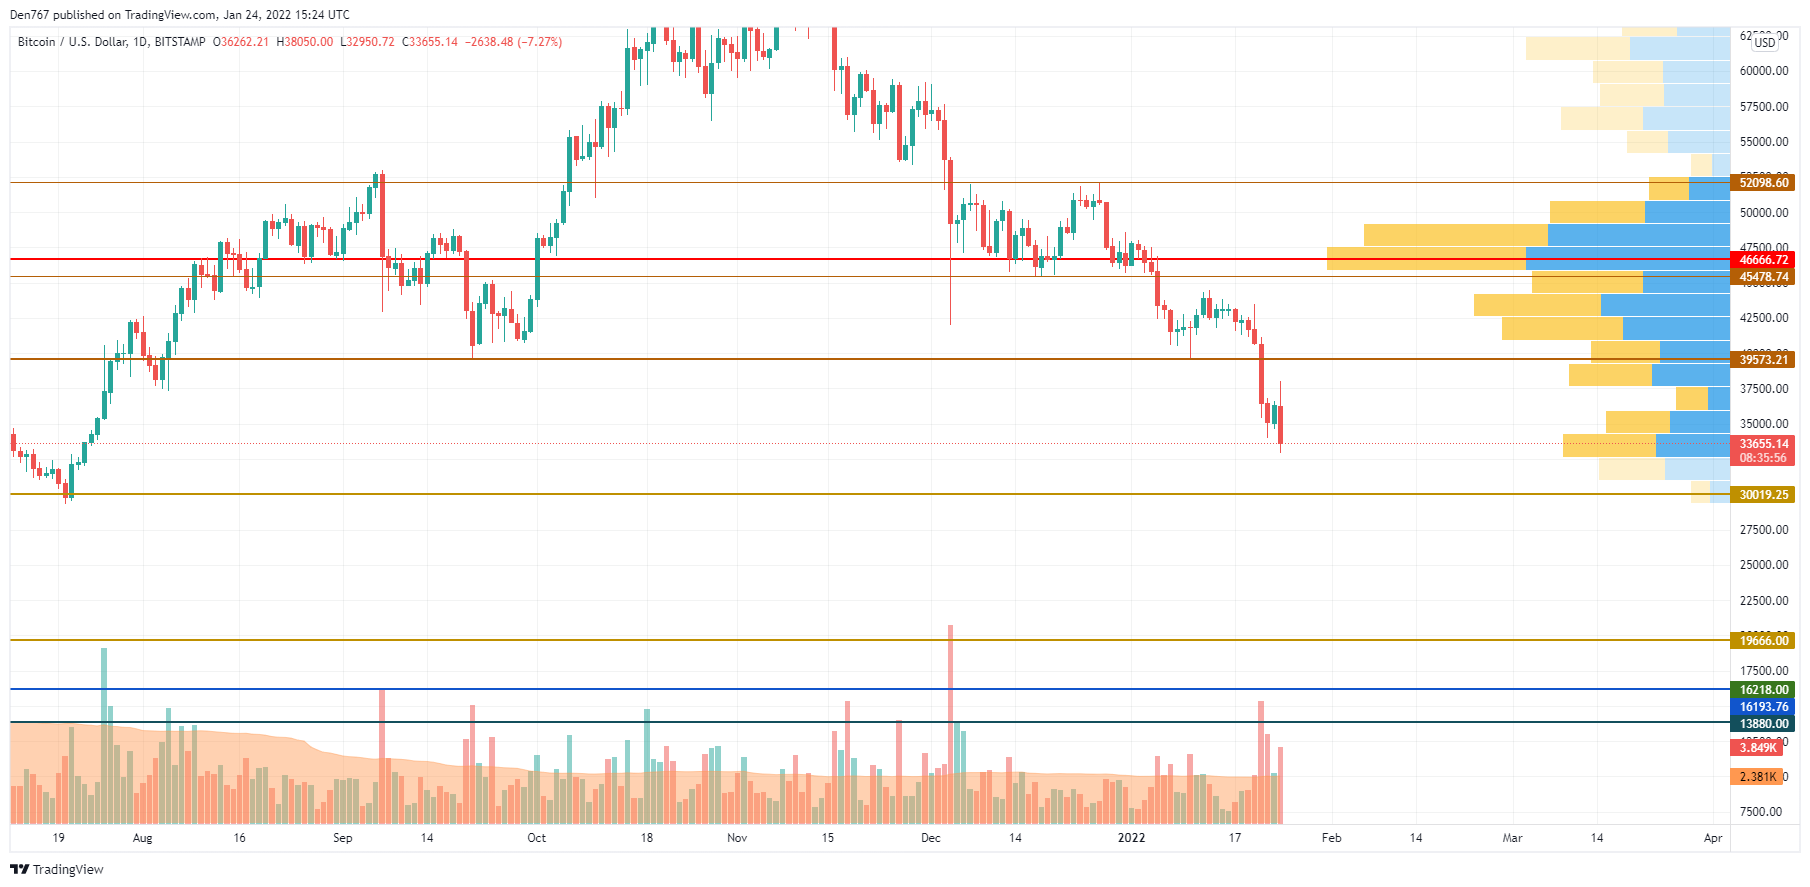
On the daily chart, the fall has continued after bulls lost the $39,573 level. At the moment, one needs to pay close attention to the support of around $30,000. There is a chance of bears losing their ground.
In this case, Bitcoin could recover to $35,000.
Bitcoin is trading at $33,869 at press time.
ETH/USD
Ethereum (ETH) is performing worse than Bitcoin (BTC). The top cryptocurrency has dropped by 8%.
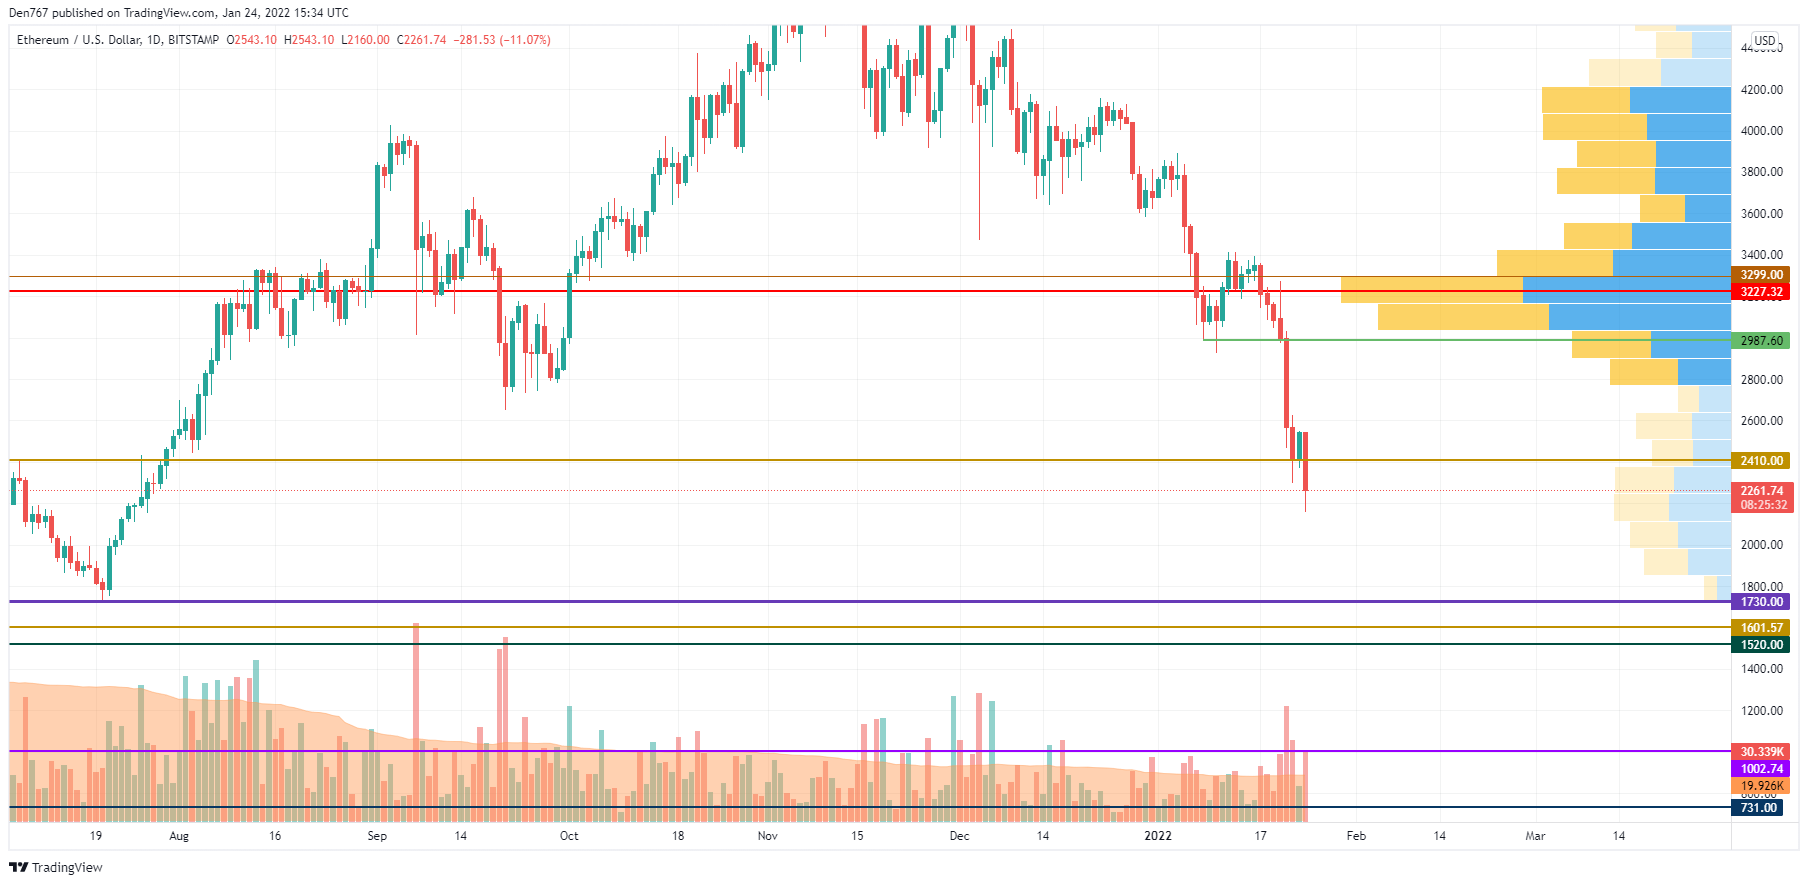
Ethereum (ETH) is looking worse than Bitcoin (BTC), with its price being below key support at $2,410. If the correction continues, ETH might plunge to $1,730. But if buyers can seize the opportunity and come back to $2,500, there might be a short-term price uptick.
Ethereum is trading at $2,266 at press time.
XRP/USD
XRP is not an exception, falling by 6.75%.
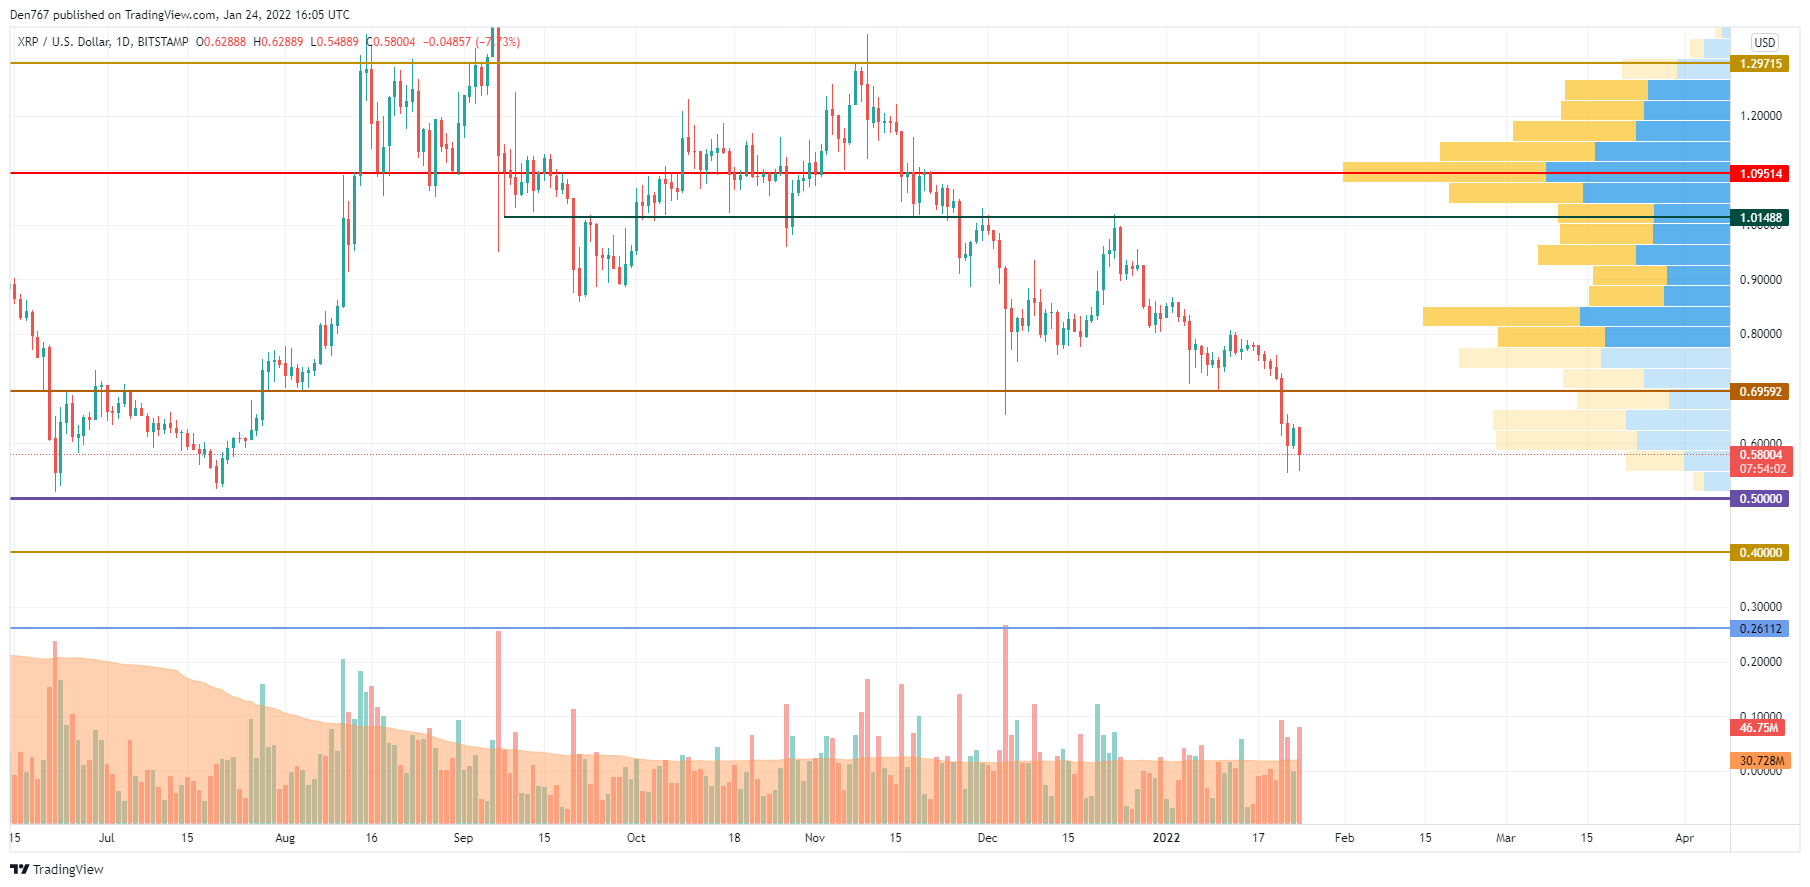
XRP is located in the middle of the channel between the support at $0.50 and the resistance at $0.69. Until the coin starts trading sideways, neither bulls nor bears are dominating the market. All in all, there is a small chance of XRP making another sharp move.
XRP is trading at $0.5786 at press time.
ADA/USD
Cardano (ADA) is performing worse than XRP, dropping by 9.31%.
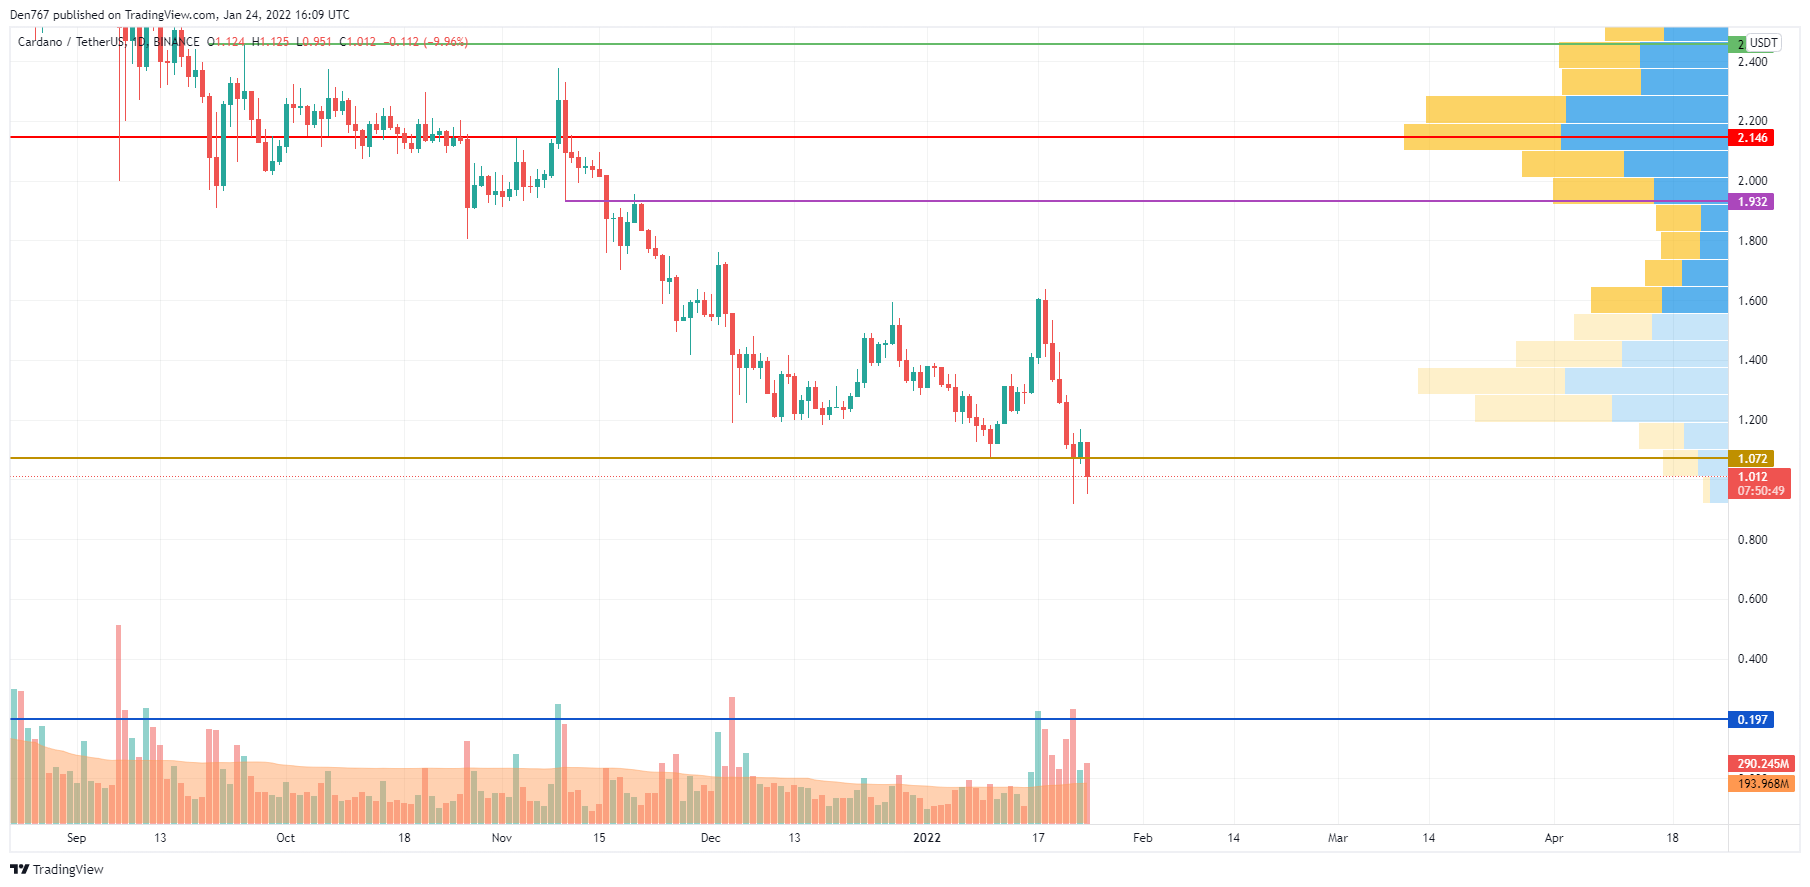
Cardano (ADA) has broken below the vital support at $1.072 on the daily chart with increasing trading volume. If bears manage to do that, there is a possibility of seeing a further drop to $0.80 within the nearest days.
ADA is trading at $1.017 at press time.
BNB/USD
Binance Coin (BNB) has followed the decline of Bitcoin (BTC), going down by 8.10% over the last day.
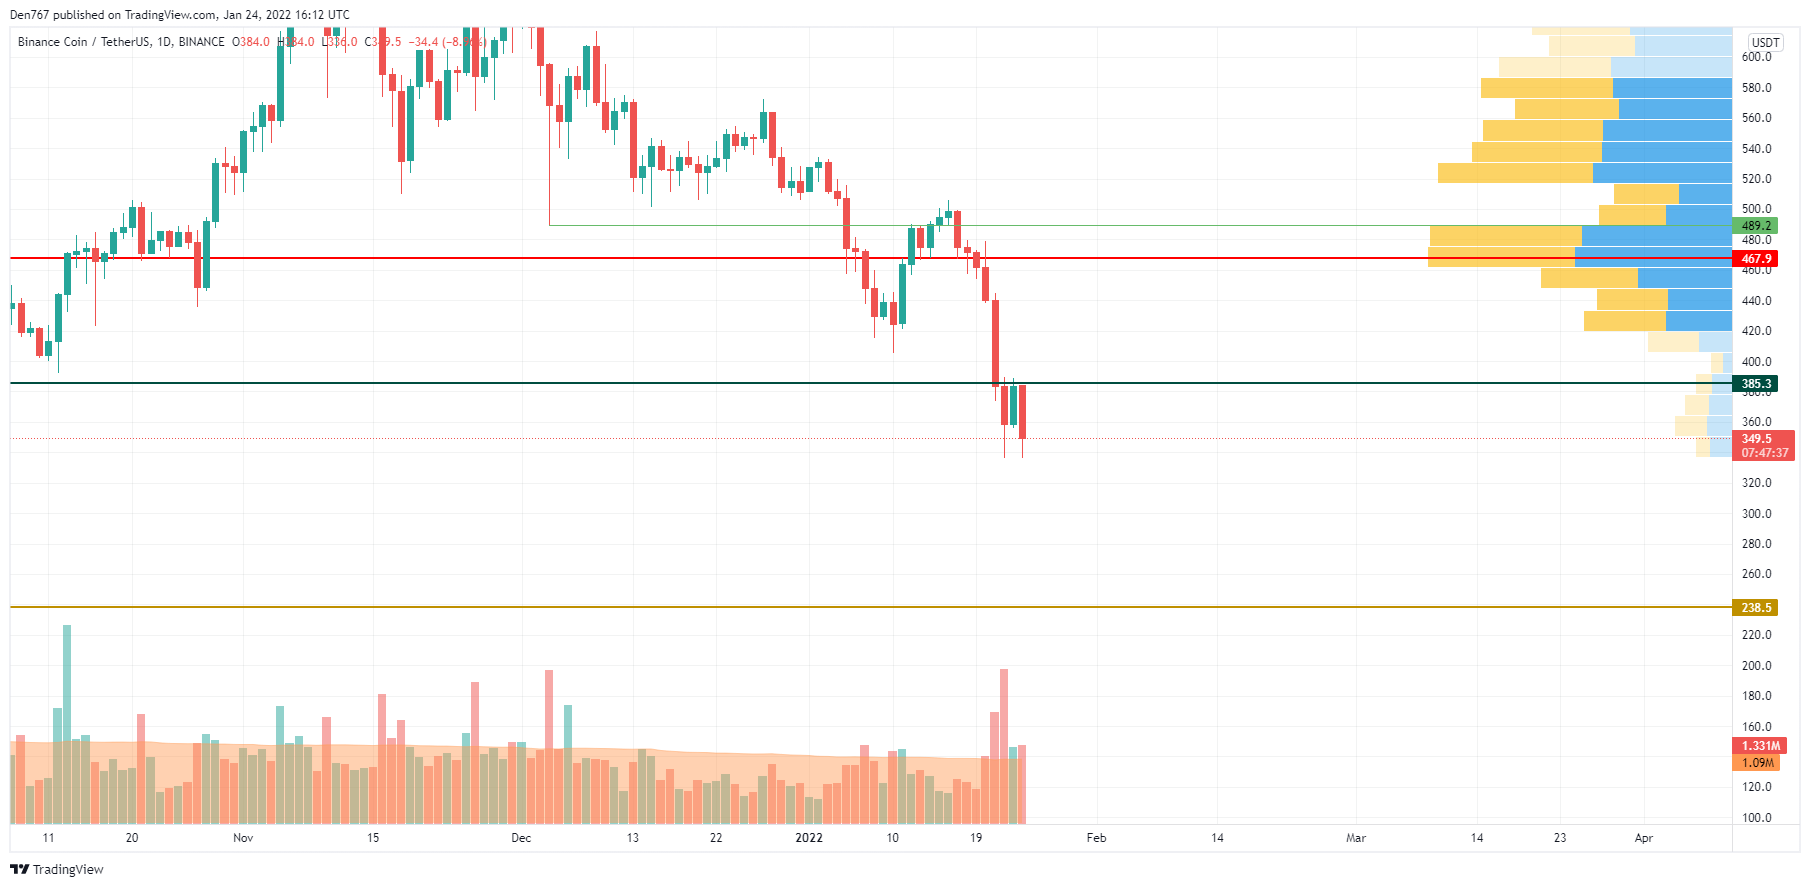
After the test of the resistance at $385, BNB has continued its fall. At the moment, bears are more powerful than bulls and if buyers are not able to hold teh price from the fall, the drop may get BNB below $300 shortly.
BNB is trading at $350.3 at press time.
SOL/USD
Solana (SOL) is the biggest loser today, dropping by 12%.
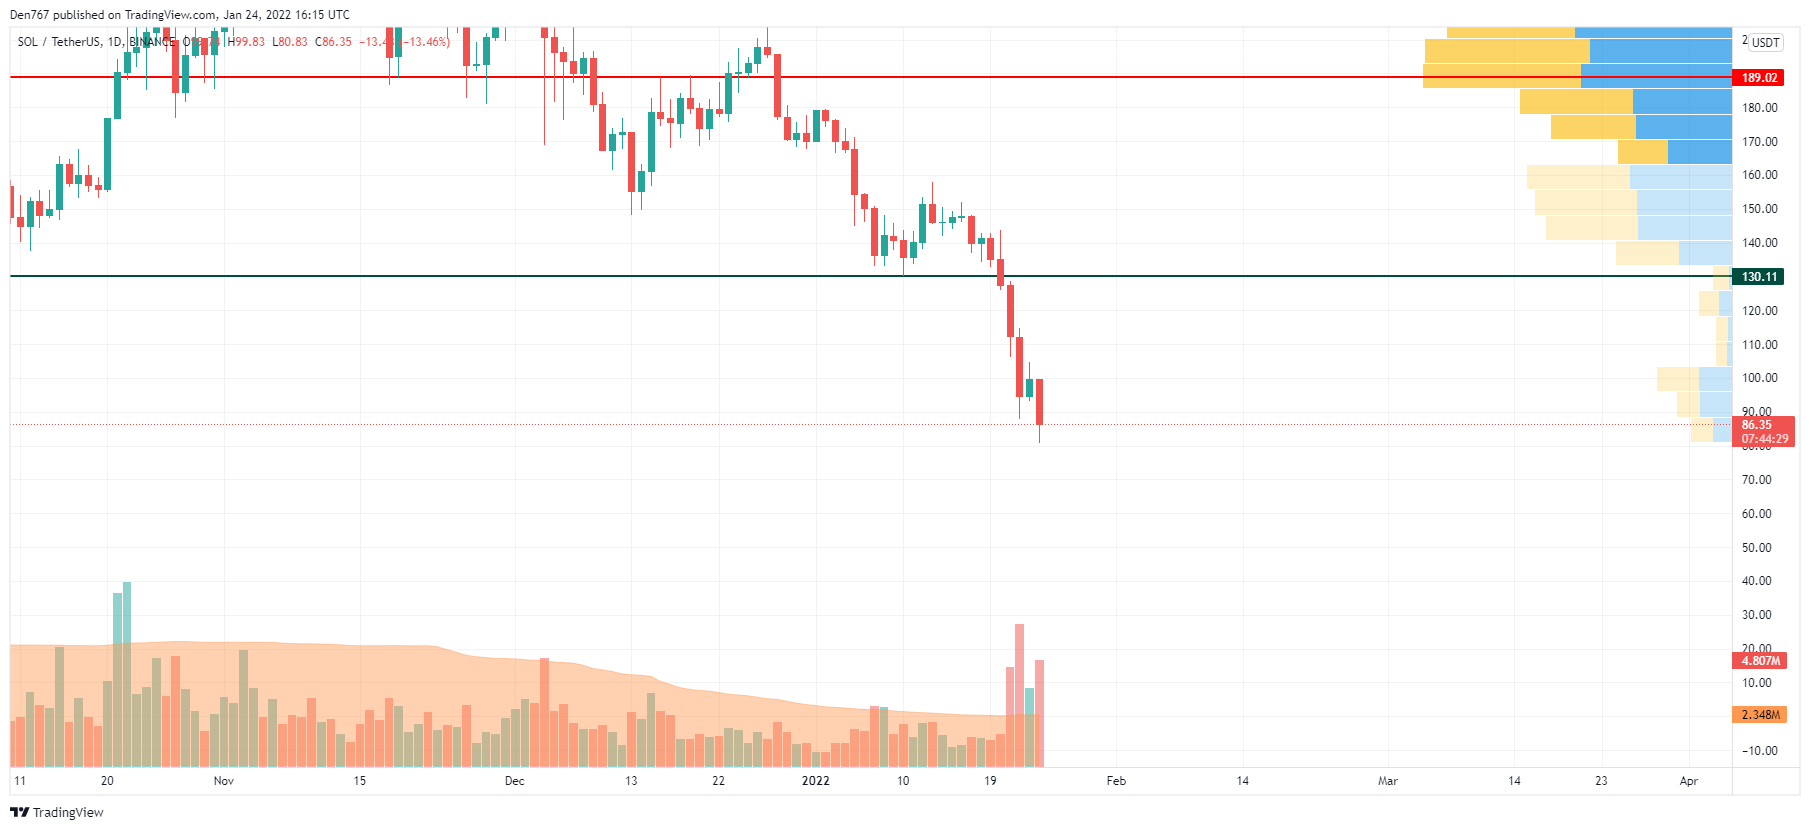
From the technical point of view, Solana (SOL) is located far away from its resistance level at $130.
One needs to pay attention to the area around $100. If the daily candle fixes above this important zone, there is a chance of seeing a short-term correction.
SOL is trading at $87.62 at press time.