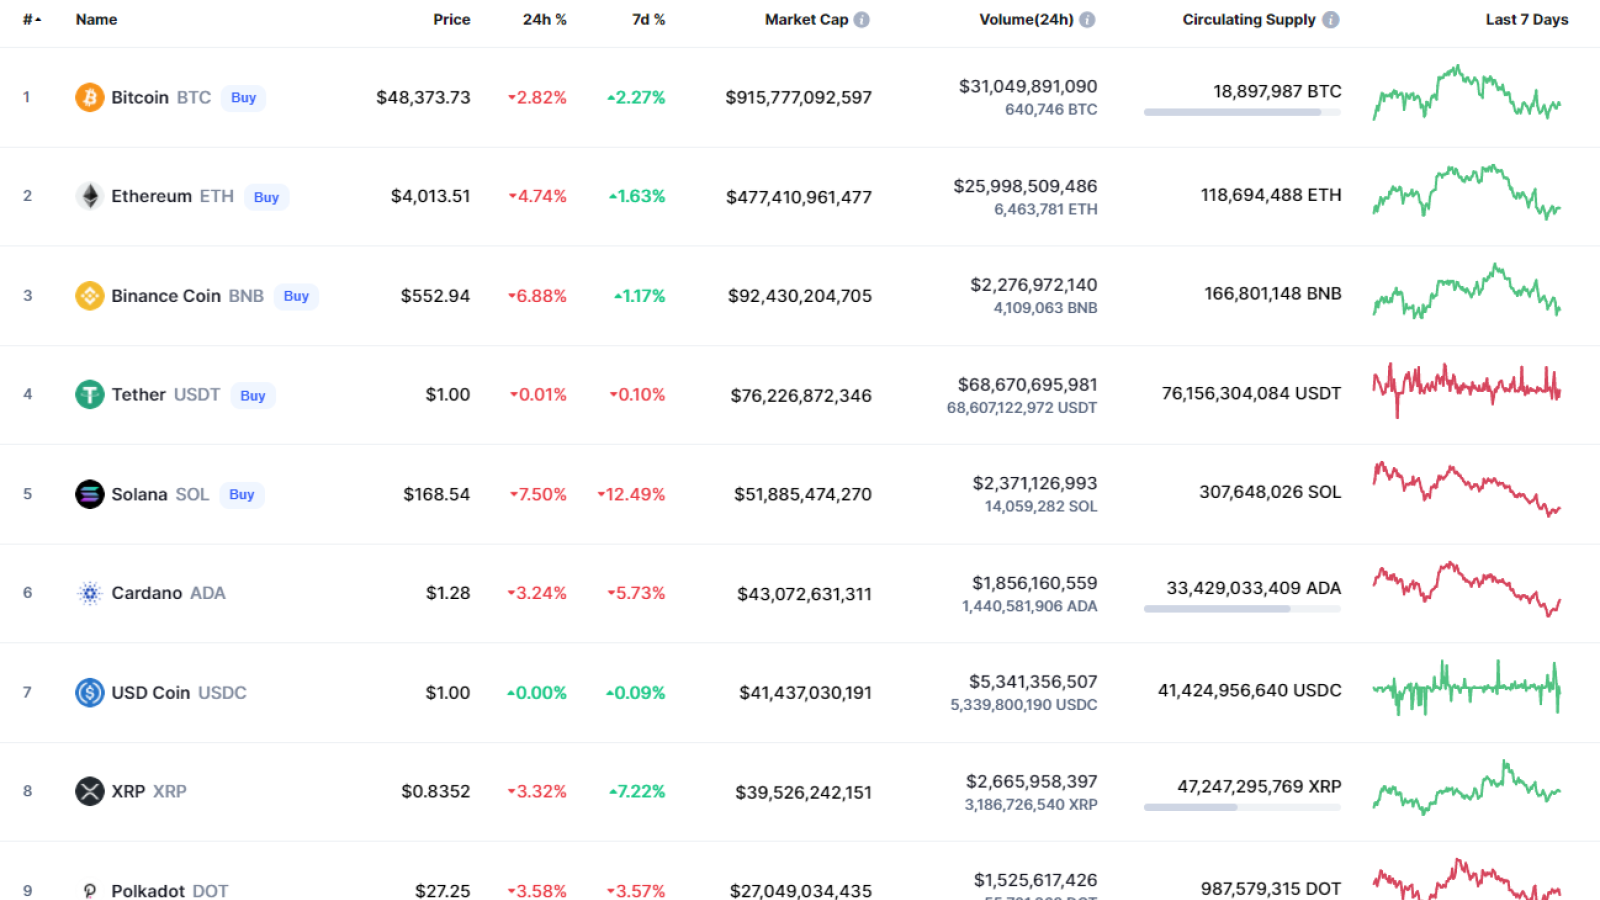
The weekend began with the continued fall of the cryptocurrency market as all of the top 10 coins are in the red zone.

BTC/USD
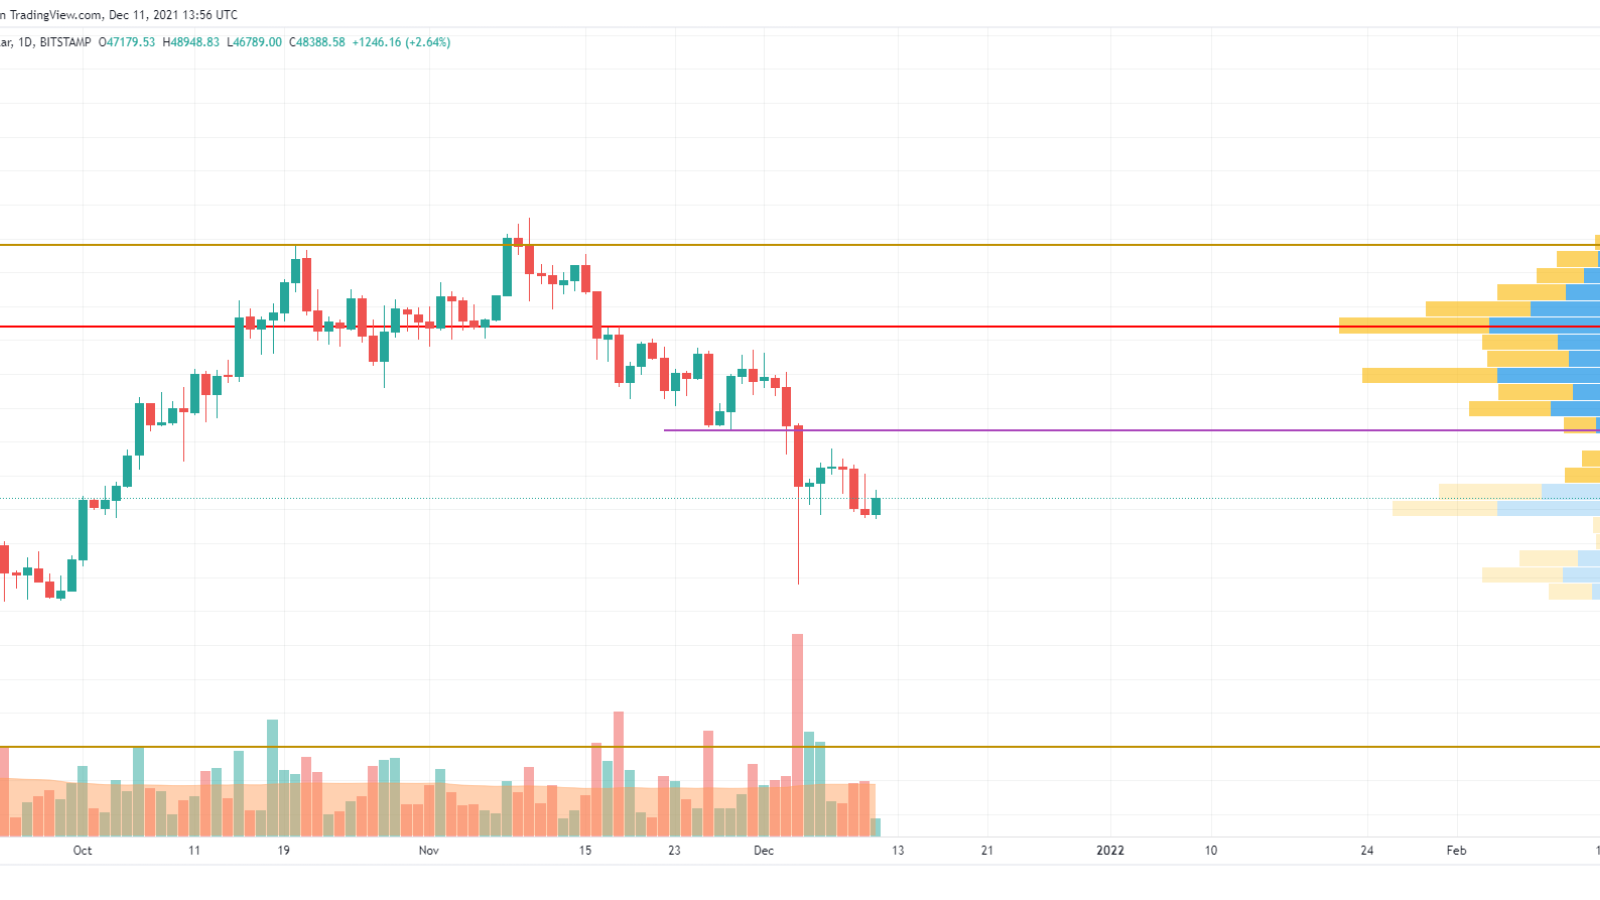
Despite yesterday’s bearish candle, the rate of Bitcoin (BTC) is trying to stay above the vital level of $47,000.

Bitcoin (BTC) keeps trading below the vital mark of $53,000. The ongoing bearish pressure is confirmed by a high selling trading volume. However, one needs to pay close attention to the area where the daily candle closes.
In case buyers can accumulate power, there is a chance to see the rise to the crucial $50,000 mark.
Bitcoin is trading at $48,335 at press time.
ETH/USD
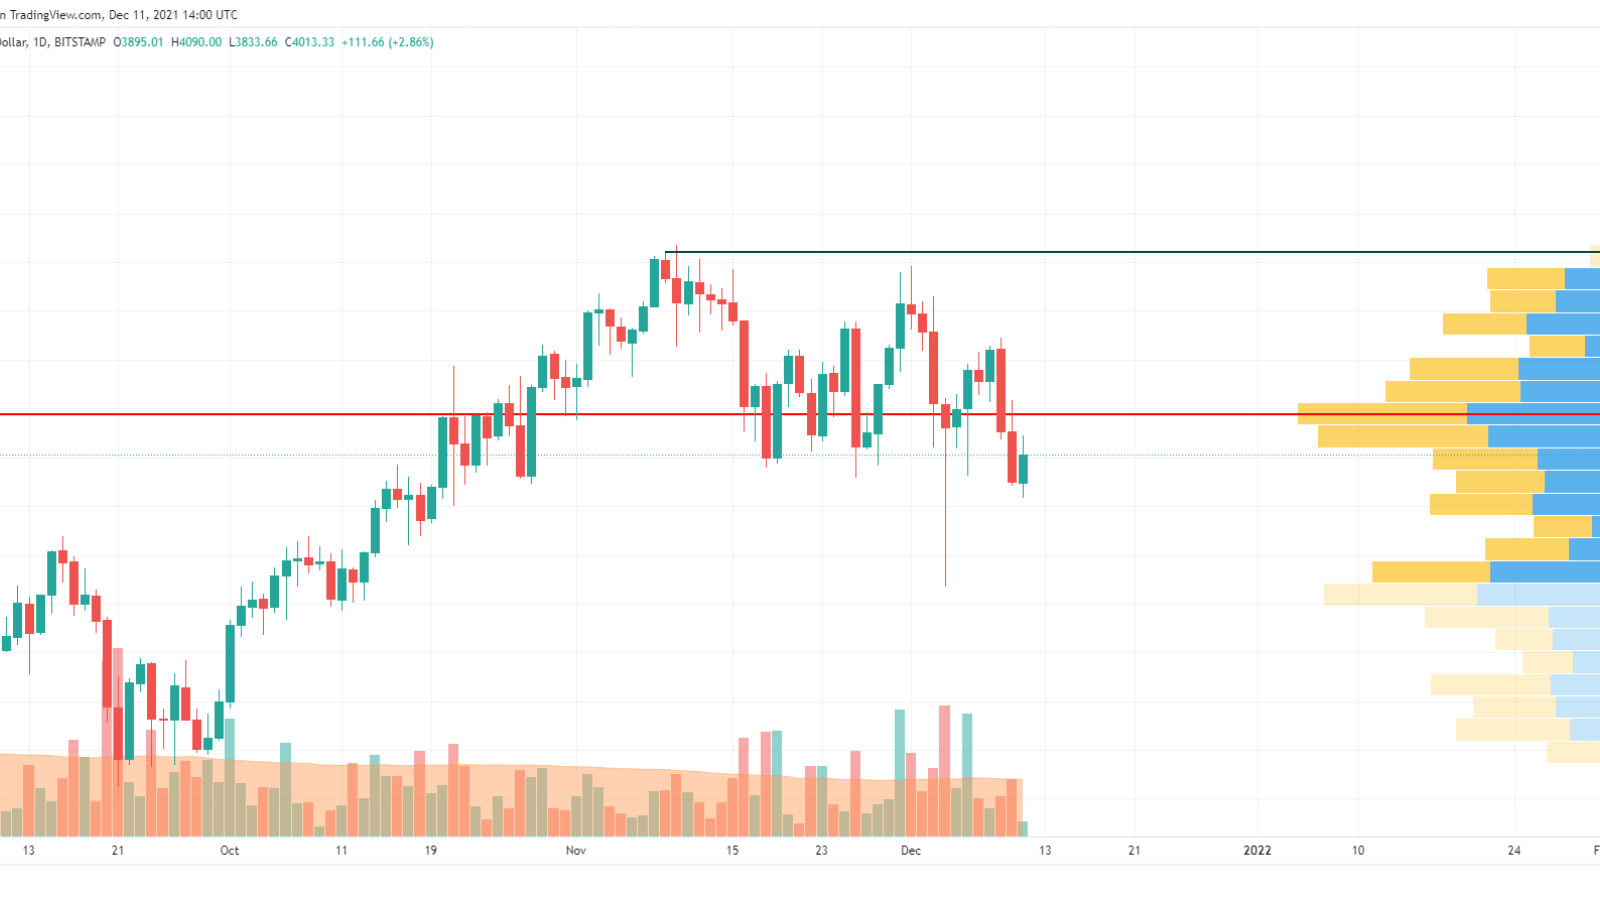
Ethereum (ETH) is the biggest loser from the list as the rate of the main altcoin has declined by almost 5% since yesterday.

Ethereum (ETH) is located in a wide channel between the support at $3,400 and the resistance at $4,842. At the moment, neither bulls nor bears have seized the initiative, which means that sideways trading is the more likely price action for the upcoming week.
Ethereum is trading at $4,017 at press time.
XRP/USD
XRP is also not an exception to the rule with a fall of 3% over the last 24 hours.

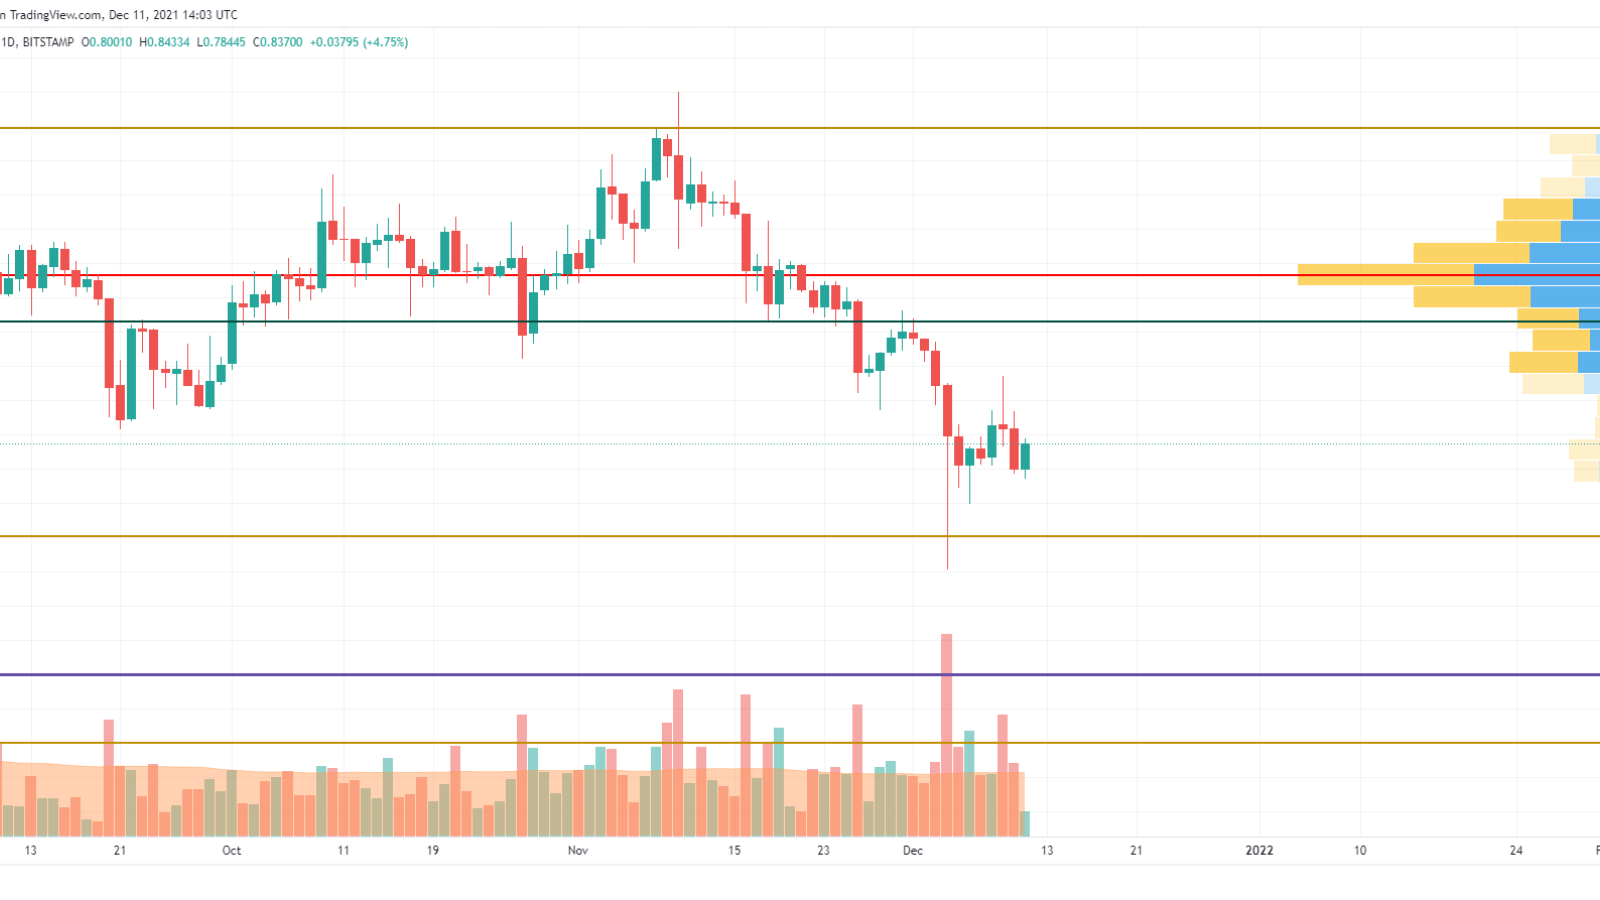
After the continued bearish trend, XRP has bounced off the important level at $0.80. While the price remains trading above it, there is a possibility to see a correction to the nearest resistance at $1.01.
However, bulls need to accumulate more strength for that, which means that this is the more likely mid-term scenario.
XRP is trading at $0.8327 at press time.

