


Indicator that predicted a reversal that led to ATH run is now sharing another reversal sign
One of the most popular technical indicators in market analysis—the Relative Strength Index—has reached extremely low values previously observed back in March 2020, which were caused by the global financial crisis.
Why this might be first sign of reversal
The Relative Strength Index is often used to determine current conditions on the market and point out reversal points once the price reaches oversold or overbought values.
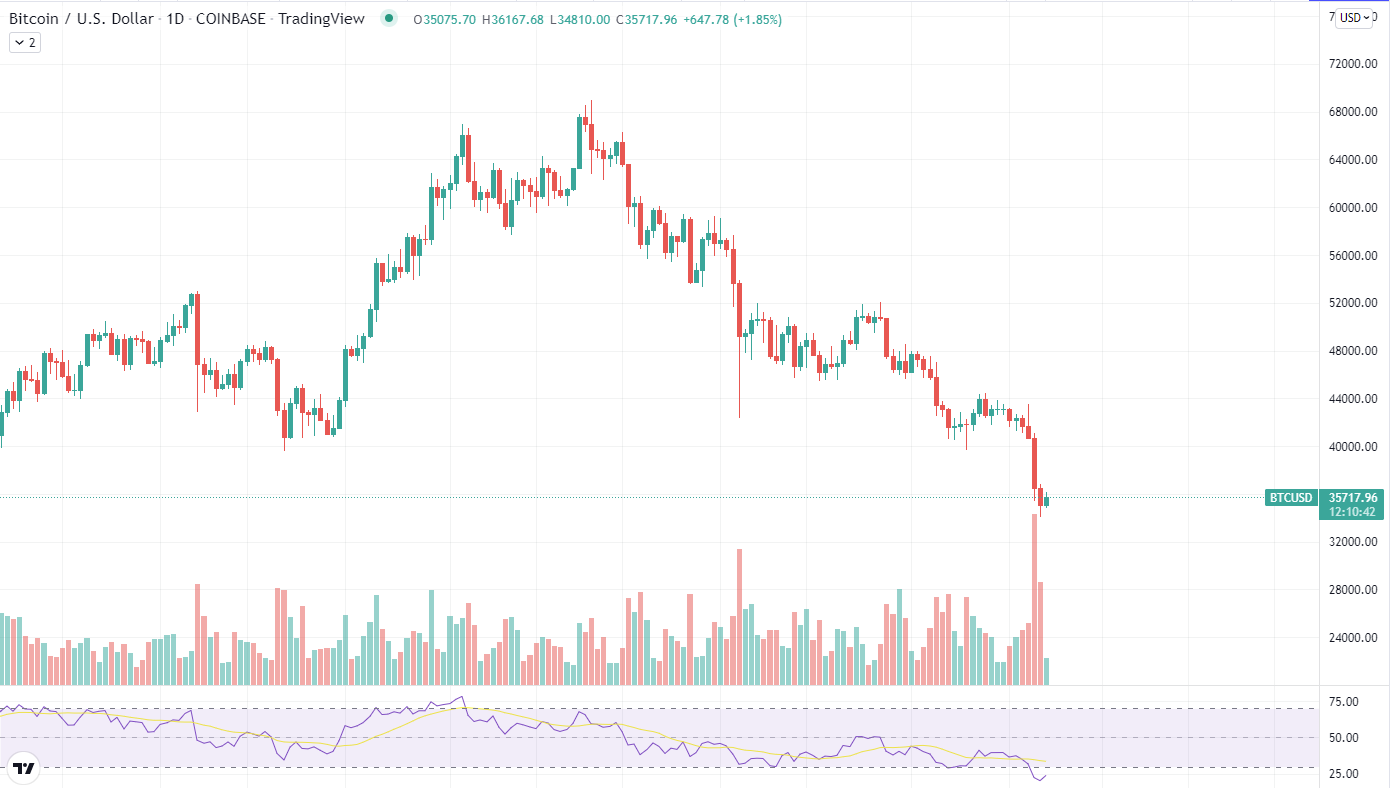
The indicator is also used to find divergences against the price chart and then determine whether the trend on the asset is reversing.
But while divergences could be considered an additional way of using the indicator, looking for oversold and overbought levels is the main way of using the Relative Strength Index.
Can the indicator predict a full reversal?
While the RSI can give us a hint about the upcoming movement in the future, it is not a panacea against the bear trend since its signals are usually considered short term. Almost every reversal signal based on RSI stays active until the indicator’s values enter the “neutral” zone.
During the last drop below the value of 25 on the indicator back in March of 2020, Bitcoin reversed almost immediately, reaching a local high of $10,000. But while the indicator “predicted” a short-term reversal, data provided by it have not suggested that the cryptocurrency would jump to the new ATH in the next few months.
At press time, Bitcoin is trading at $35,865 after another unexpected drop that occurred during the asset’s correction that began back in November, when the digital gold was trading at almost $70,000.