

Article by The Rational Root with writing supplemented by Sam Rule.
Abstract
The “HODL model hypothesis” is that bitcoin has crossed a historic inflection point where the asset’s illiquid supply is outpacing the rate of new supply issuance. Future halvings with lower supply issuance will only exacerbate this divergence.
Illiquid supply as a percentage of circulating supply will grow in a parabolic fashion as bitcoin’s digital scarcity drives investor behavior towards store of value as the dominant use case. As a result, illiquid supply will approach 80% of circulating supply by 2036.
Disclaimer: This is a market hypothesis and not investment advice; it should not be treated as such.
What Is Illiquid Supply?
It’s essential to understand the liquidity profile of bitcoin’s circulating supply. Quantifying supply across different levels of liquidity helps us better understand market supply dynamics, investor sentiment and bitcoin’s price trajectory.
Liquidity is quantified as the extent to which an entity spends their bitcoin. A HODLer that never sells has a liquidity value of 0 whereas someone who buys and sells bitcoin all the time has a value of 1. With this quantification, circulating supply can be broken down into three categories: highly liquid, liquid and illiquid supply.
Illiquid supply is defined as entities that hold over 75% of the bitcoin they take in. Highly-liquid supply is defined as entities that hold less than 25%. Liquid supply is in between.
This illiquid supply quantification and analysis[1] was developed by Rafael Schultze-Kraft, cofounder and CTO of Glassnode.
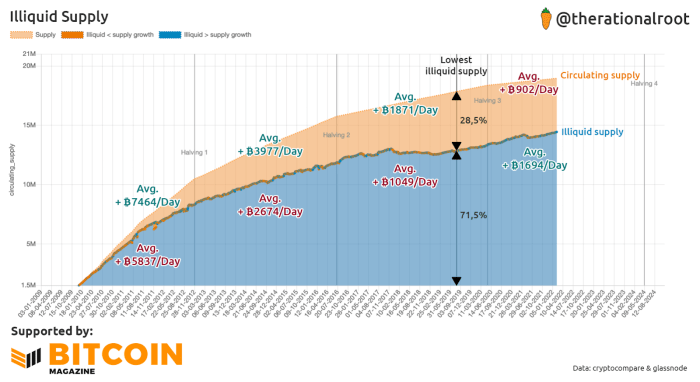
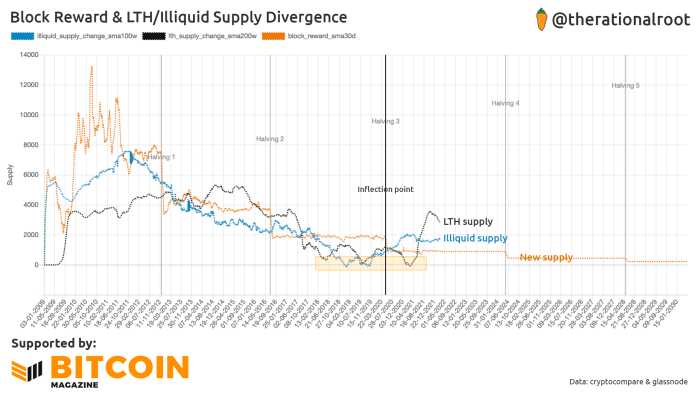
The below chart shows the history of illiquid supply and circulating supply growth highlighting the average bitcoin added per day across each halving cycle. Since the third halving, illiquid supply growth has been outpacing circulating supply growth for the first time in bitcoin’s history, adding 1,694 bitcoin per day compared to 902 bitcoin per day. Illiquid supply bitcoin per day growth has accelerated 61.48% into this third halving epoch relative to the second halving, reversing a historic macro trend of decelerating, positive illiquid supply growth.
Illiquid Supply As A Percentage Of Total Supply
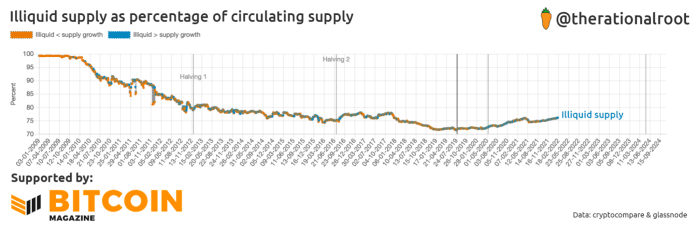
At the time of writing, illiquid supply accounts for 76.22% of all circulating supply totalling 14,452,208 bitcoin. This is the highest illiquid supply percentage of circulating supply since December 2017. After reaching a bottom in July 2019, bitcoin’s illiquid supply share has grown from 71.47%.
Even during bitcoin’s violent liquidations cascade and its 53.98% July 2021 drawdown from approximately $64,000 to below $30,000, illiquid supply share only fell to 74.49% from 76.01%. Over time, more of the circulating supply is finding its way into illiquid supply hands, i.e., investors who have shown that they are unlikely to part with the majority of their bitcoin.
HODL Model
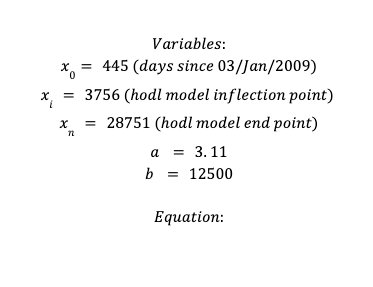
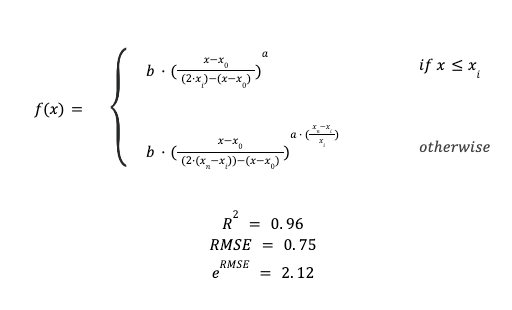
There’s been little work done to model out what the future market impacts of a growing illiquid supply share of circulating supply may look like. The HODL model aims to do this using a logarithmic equation, giving us an inflection point where illiquid supply growth began to outpace new issuance growth. The equation is defined below:
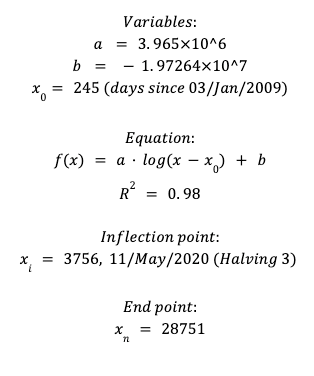
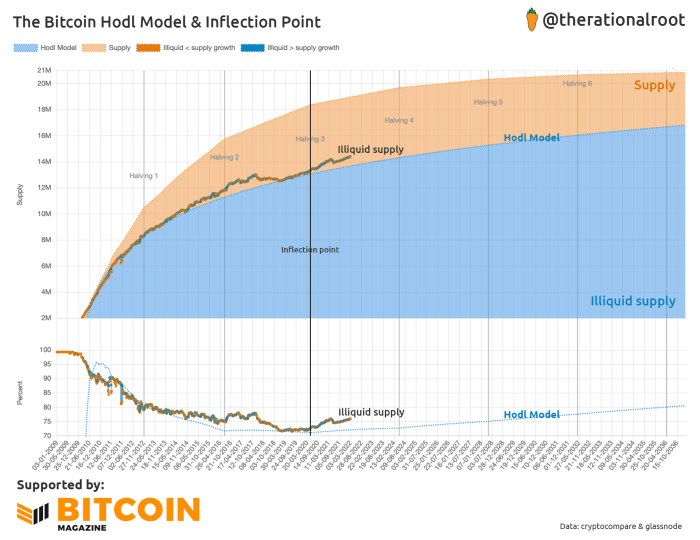
The model results and chart below show what the future may look like if we’re to see the illiquid supply percentage continue this trend. The model’s inflection point occurs at the third halving, which nears the historic low in the illiquid supply percentage of circulating supply. Post this inflection point, the HODL model takes a conservative approach to project illiquid supply growth and aims to act as a floor model.
By the next (or fourth) halving in 2024, the illiquid supply “floor” percentage will be 72.5% or 14.3 million bitcoin. By the sixth halving in 2032, illiquid supply “floor” percentage will be 77.5% or 16 million bitcoin.
The Case For An Inflection Point
As bitcoin’s block reward will fall from the current 6.25 BTC per block to 3.125 BTC and 1.5625 BTC over the next two halvings, there will be a significant reduction in new supply issuance. Approximately 164,000 new bitcoin will be issued per year during our fourth halving period, and approximately 82,000 will be issued per year during our fifth. This will result in approximately 984,000 BTC new supply issued over the next two halvings (roughly eight years).
In 2021, illiquid supply increased by 366,060 BTC. In 2020, it increased by 837,430 BTC and 588,412 in 2019. This is calculated using the difference in illiquid supply on December 31 of each year compared to the prior year. We would have to experience a major market behavioral shift to see illiquid supply fall below the declining new supply issuance over the next decade. This type of shift would invalidate the model.
A key reason for using the inflection point to model HODL behavior is because of the historical, exponential growth seen in long-term holder supply. Although long-term holder supply fluctuates significantly during cyclical tops and bottoms, the macro trend of growing long-term holder supply is evident over bitcoin’s lifetime.
After a coin has sat for 155 days or approximately five months, it becomes statistically unlikely to be spent based on previous Glasssnode short- and long-term holder analysis[2]. This sets the threshold for long-term holder supply which has significant crossover with illiquid supply as both capture bitcoin HODLer behavior.
The chart below shows the pace at which new supply enters circulation (through the block reward) and the pace at which circulating supply becomes long-term holder and/or illiquid supply. The highlighted orange box seems to mark a bottom of a 10-year downtrend. While we know new supply entering circulation will continue to further decrease, a divergence looks to emerge at the inflection point.
Will Illiquid Supply Approach 100%?
With Bitcoin’s primary use case being a store of value and the hard cap of 21 million, one could assume that illiquid supply will trend towards 100%. The HODL model projects that the entire supply of bitcoin will become illiquid by 2088 (the HODL model end point), but this is unrealistic as the 21 million bitcoin supply hard cap will be approached but never reached. By the seventh halving in 2036, the HODL model projects illiquid supply to reach 80%. The HODL model aims to be conserative in its estimates of illiquid supply share growth.
The model does not make any assumptions on significant market behavioral changes or future inflection points in declining illiquid supply. As illiquid supply approaches 100% share of circulating supply, we don’t know what downward pressures may reverse this trend of illiquid supply growth.
One potential downward pressure is the growth of bitcoin’s use case as a medium of exchange, which could increase bitcoin’s supply liquidity profile. Likely a reason for a structural change in illiquid supply growth (or second inflection point) is a decrease in demand after hyperbitcoinization, when bitcoin absorbs most value in the world.
That said, illiquid supply can grow indefinitely as bitcoin is infinitely divisible. The Lightning Network allows for milli-satoshis to be sent while the smallest unit on-chain is only a satoshi. Even with dividing the supply that can be used for more liquid use cases down into smaller units, it’s still likely we see a potential second inflection point where illiquid supply growth slows down.
HODL Model Impact
As illiquid supply rises, so do the market impacts of bitcoin’s digital scarcity. Liquid and highly-liquid supply will tighten as illiquid supply grows, leaving less bitcoin available on the market to acquire or trade.
New waves of demand that enter the market to acquire this declining available supply will then lead to exponential price increases. Exponential price increases will incentivize that some illiquid supply transition to liquid and highly-liquid supply as HODLers take profit, but this impact will be negligible relative to the overall impact of illiquid supply growth during bitcoin’s monetization phase.
This can be seen by looking at significant profit-taking periods in bitcoin’s history where illiquid supply had fluctuations but continued to grow emphasizing investors’ overall long-term preference and view of the asset. The short-term decline in the illiquid supply share during July 2021, before resuming its upward trajectory, is one of those periods.
The HODL Price Model
The HODL model predicts a conservative estimate of bitcoin’s available supply where illiquid supply follows the growth curve we saw above. Since illiquid supply share nears a low at the inflection point, a logical consequence would be for bitcoin price to follow an inverse s-curve pattern.
With tighter liquid and highly-liquid supply, we see high increases in price at the beginning of bitcoin’s lifetime and then moderate price increases near the third halving’s inflection point. As available supply tightens again, we should expect higher price increases to follow.
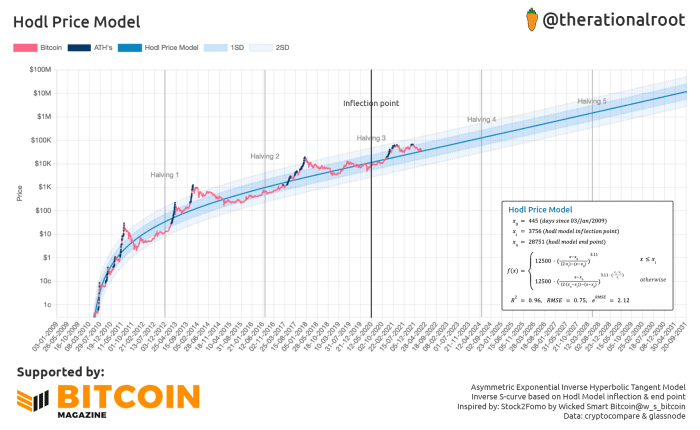
To model this behavior we can use an exponential inverse hyperbolic[3] tangent model.
Wicked Smart Bitcoin created the Bitcoin Stock2Fomo Hyperbolic Model[4] to show a potential model of bitcoin’s price during a fiat hyperinflation scenario.
We build further upon this model below to show bitcoin’s digital scarcity as the HODL price model. But instead of using a symmetric s-curve, we utilize the HODL model to create an asymmetric s-curve following the projections of illiquid supply.
The Price Model Does Not Account For Future Demand
Fiat inflation and an increasing illiquid supply share of circulating supply assumptions are the driving forces that create an inverse s-curve pattern. However, one of the HODL price model’s shortcomings is that it assumes a constant flow of demand for bitcoin’s available liquid and highly liquid supply.
New demand will not be a smooth constant resulting in the future bitcoin price to oscillate above and below the model’s predicted value. The model aims to take a more conservative stance on bitcoin’s price history.
Lengthening Cycle
The HODL price model leverages the HODL model inflection point at its center. The inflection point, occurring at the third halving in 2020, supports a significant change in market structure which may contribute to the idea of lengthening cycles.
The abundance of liquid and highly-liquid supply near the inflection point (the flattest part of the s-curve) may be a cause for the current, relative sideways and ranging price action compared to previous cycles.
Although liquid and highly-liquid supply tightening cycles could again shorten, it is perhaps more likely that the diminishing effect of the halvings cycles will be less impacted. This may result in more natural boom/bust cycles varying in length based on other catalysts and market conditions.
The model results and chart below show the inverse s-curve pattern following the HODL model’s hypothesis and illiquid supply projections. Unlike a log-curve with a continuous decreasing slope, the HODL price model has an increasing slope from the inflection point onwards. The HODL price model projects bitcoin price to reach $1,000,000 near the fifth halving around 2028.
References
- https://insights.glassnode.com/bitcoin-liquid-supply/
- https://insights.glassnode.com/quantifying-bitcoin-hodler-supply/
- https://en.wikipedia.org/wiki/Inverse_hyperbolic_functions
- https://twitter.com/w_s_bitcoin/status/1492511360193900547
This is a guest post by The Rational Root. Opinions expressed are entirely their own and do not necessarily reflect those of BTC Inc or Bitcoin Magazine.