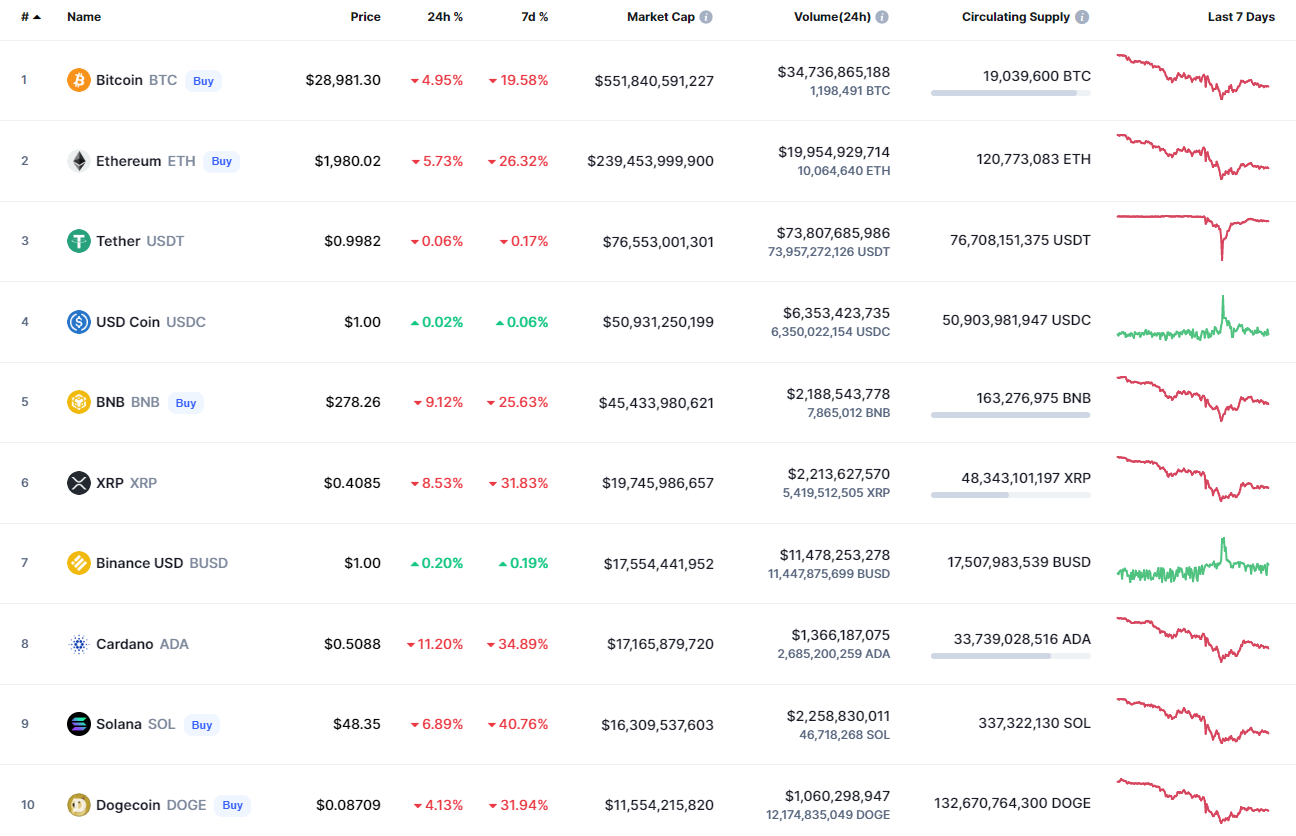
The sharp bounceback has been changed by a further drop as all of the top 10 coins are in the red zone.
BTC/USD
Bitcoin (BTC) is going down, falling by almost 5% over the last 24 hours.
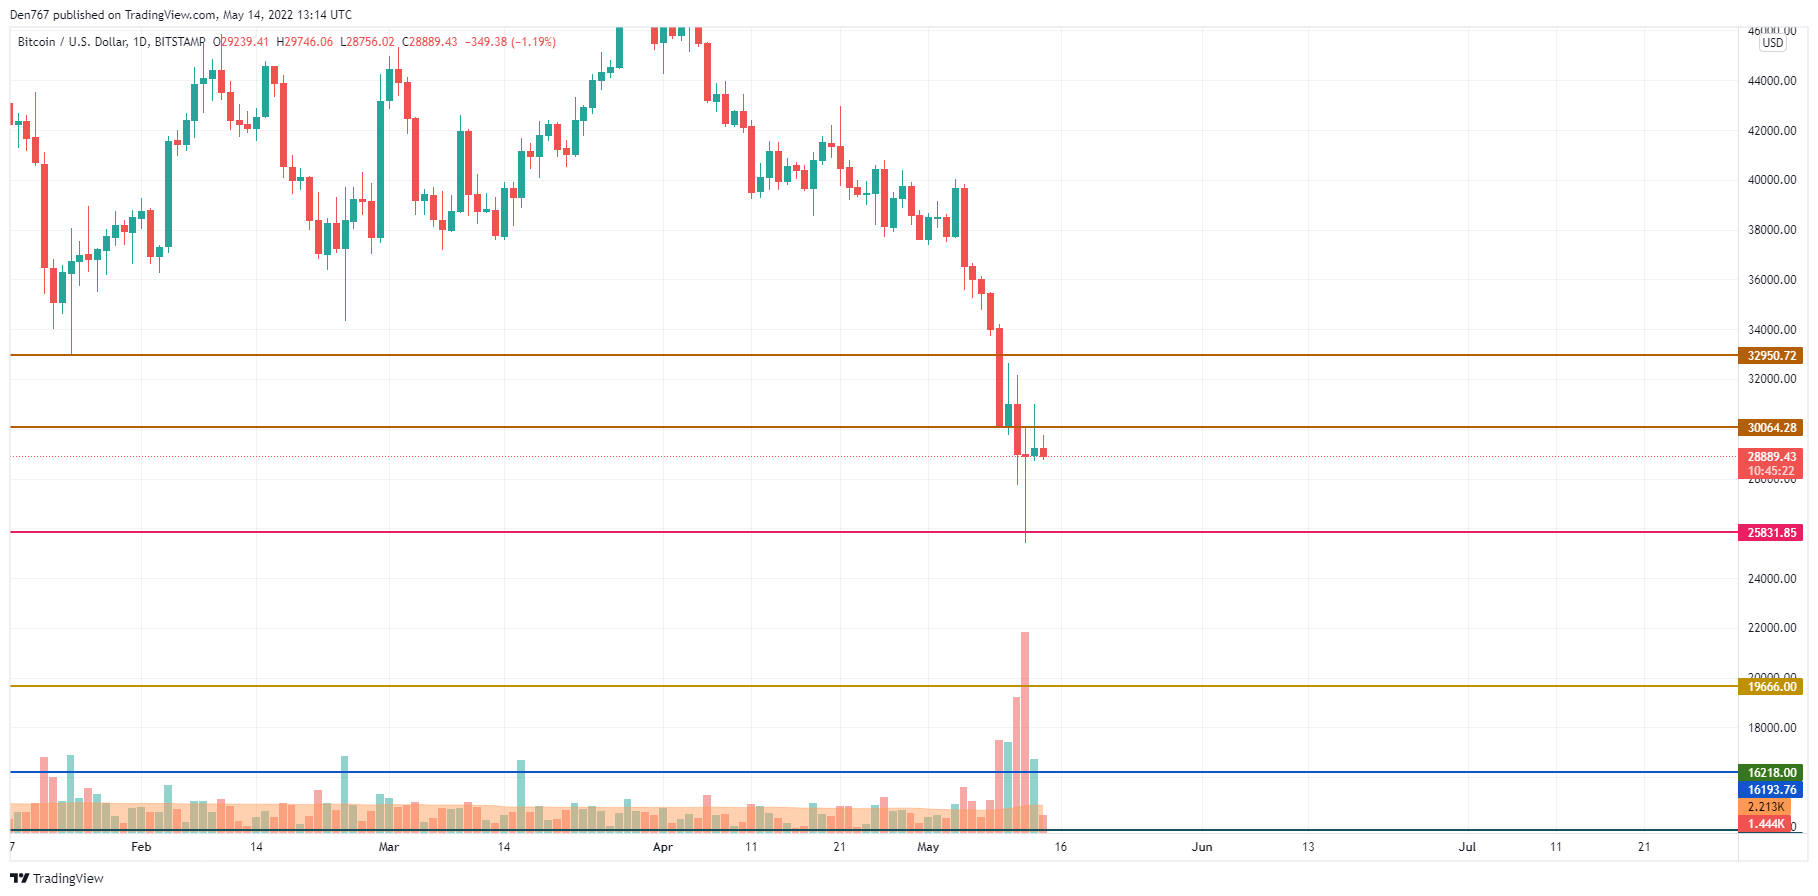
On the daily chart, Bitcoin (BTC) could not fix above $30,000 for a long time, which means that it is too early to consider a trend reversal. In this case, if the selling volume increases and the price remains below the $29,000 mark, there is a high chance to see the test of the recently formed local low at $25,400.
Bitcoin is trading at $28,815 at press time.
ETH/USD
Ethereum (ETH) has lost even more than Bitcoin (BTC) with a decline of 5.73%.
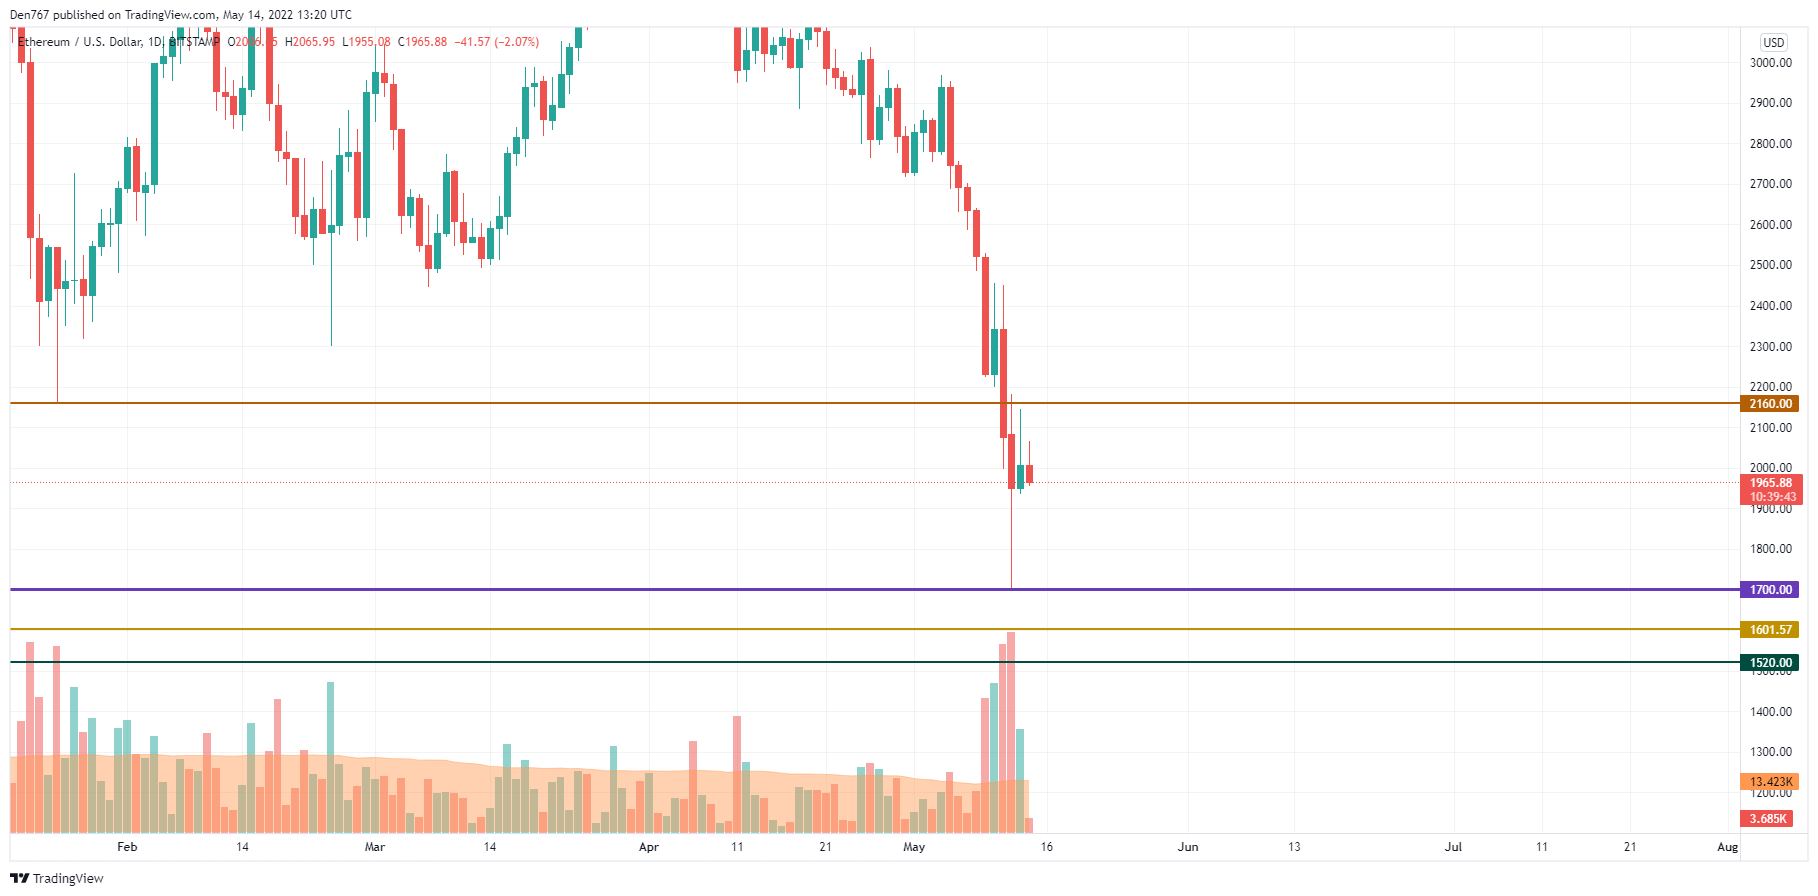
Ethereum (ETH) is trading below the vital level of $2,160. If buyers cannot seize the initiative and return the rate to the zone of $2,000-$2,120, the ongoing drop may continue to the $1,900 mark. Thus, the low trading volume confirms buyers’ weakness.
Ethereum is trading at $1,975 at press time.
XRP/USD
XRP is not an exception to the rule, going down by almost 10%.
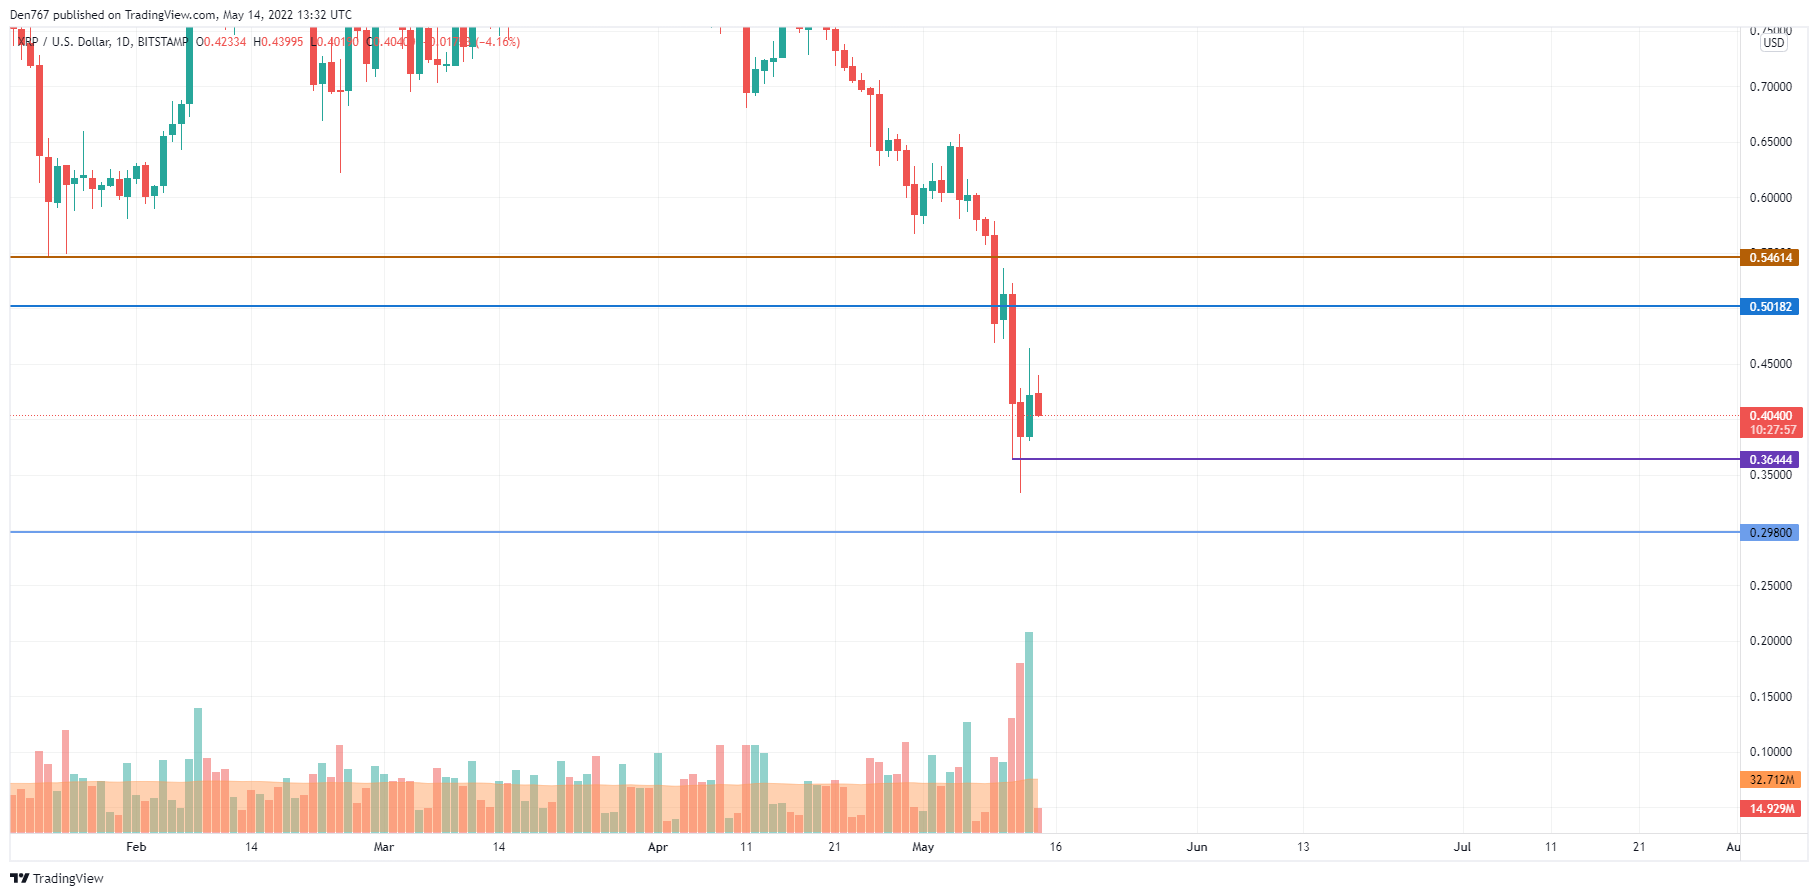
XRP made a false breakout of the $0.45 mark against the increased trading volume. At the moment, one needs to pay close attention to the recently formed level at $0.3644. If the price returns to it, the drop may continue below $0.35 next week.
XRP is trading at $0.4037 at press time.
ADA/USD
Cardano (ADA) is the biggest loser from the list today with a decline of 12.88%.
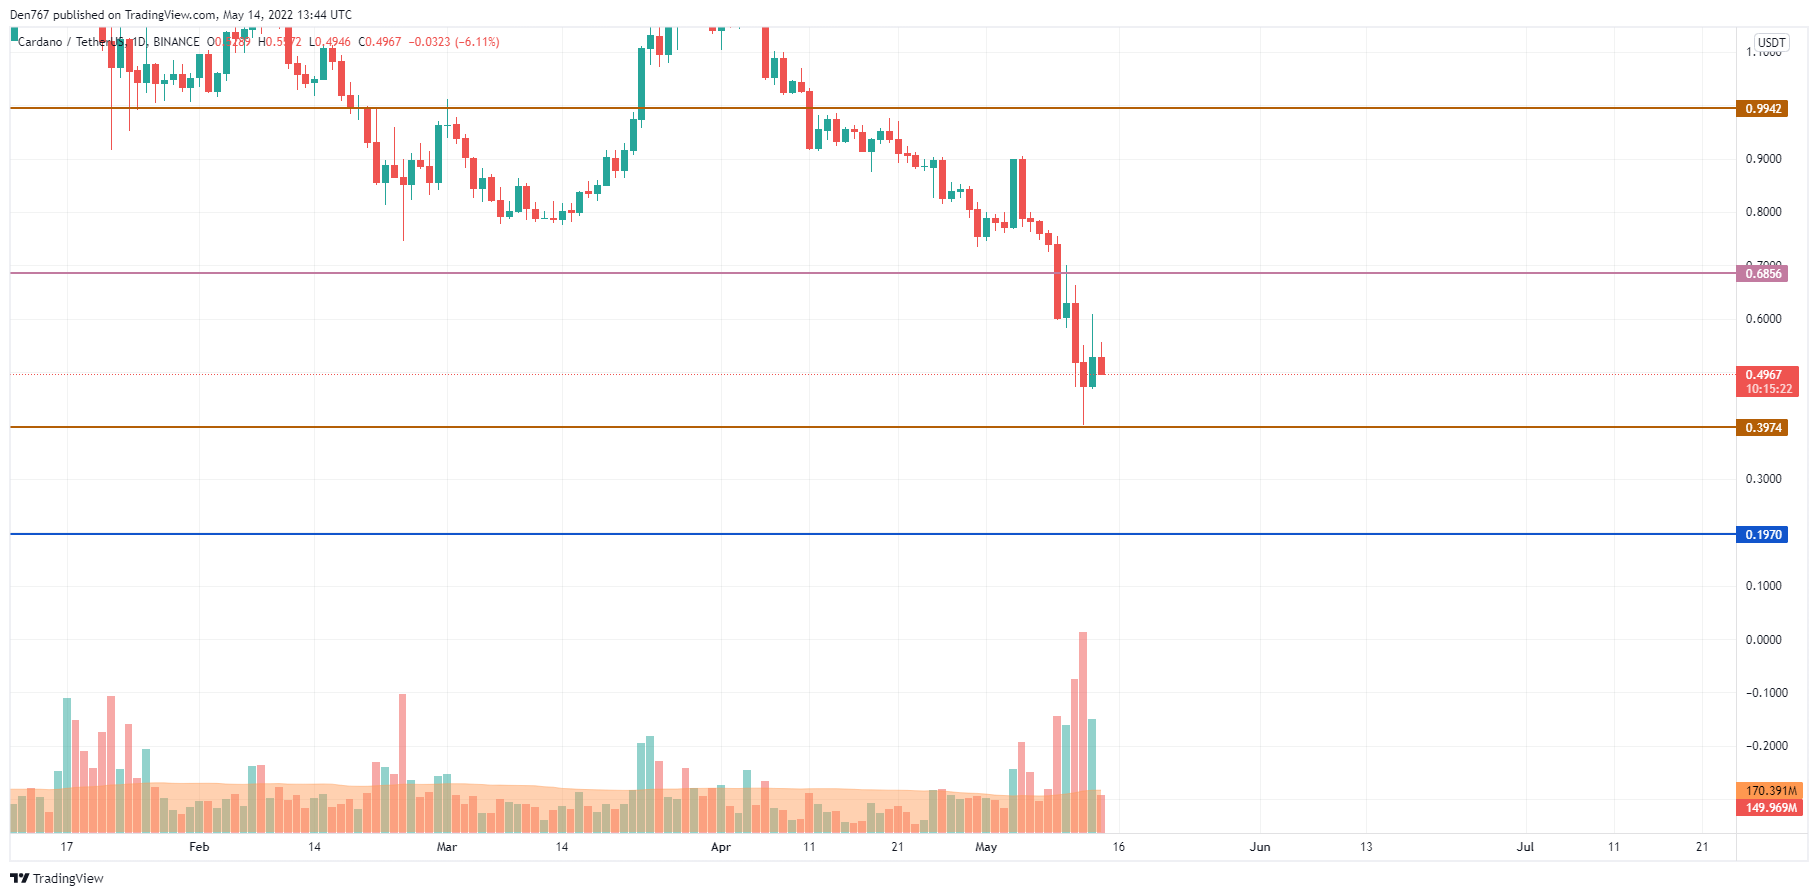
From the technical point of view, Cardano (ADA) is trading similarly to XRP, as the coin could not fix above the $0.60 mark. Currently, there are no prerequisites for a short-term rise, and the daliy closure below $0.50 can prompt a downward move.
ADA is trading at $0.4955 at press time.
BNB/USD
Binance Coin (BNB) has followed the drop of other coins, losing 10% of its price since yesterday.
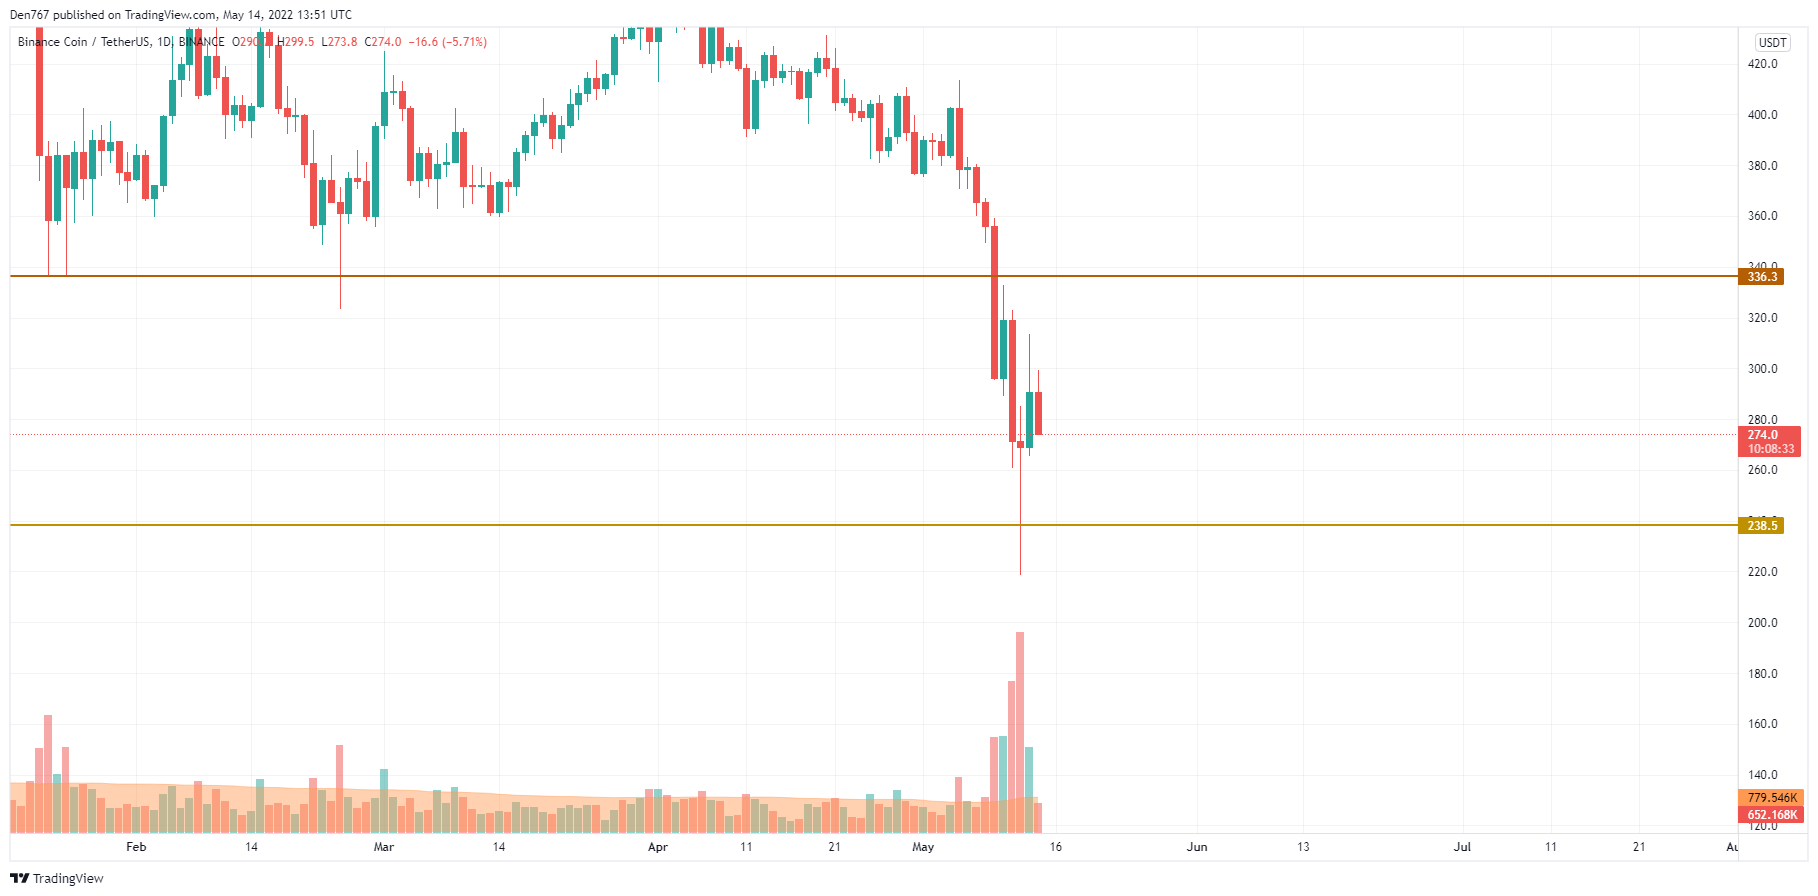
Binance Coin (BNB) could not keep the rise after yesterday’s bullish candle, followed by the false breakout of the $300 mark. Currently, the nearest zone is around $240, which is important for bulls in terms of a possible rise. However, if the decline continues, there is a probability of seeing the test of $200 by the end of the month.
BNB is trading at $274.7 at press time.

