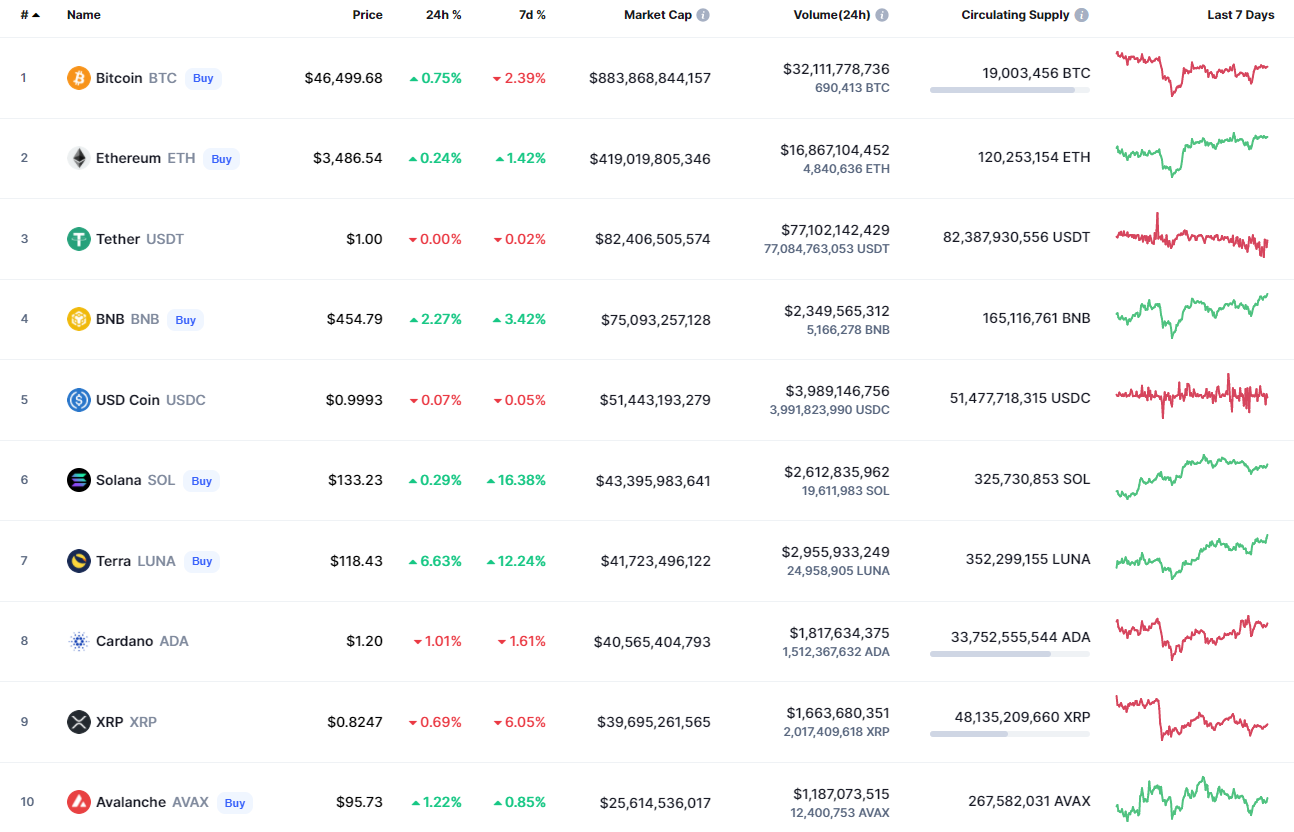
Bulls have turned out to be more powerful than bears as most of the coins are again trading in the green zone.
BTC/USD
The rate of Bitcoin (BTC) has increased by 0.68% over the last 24 hours.
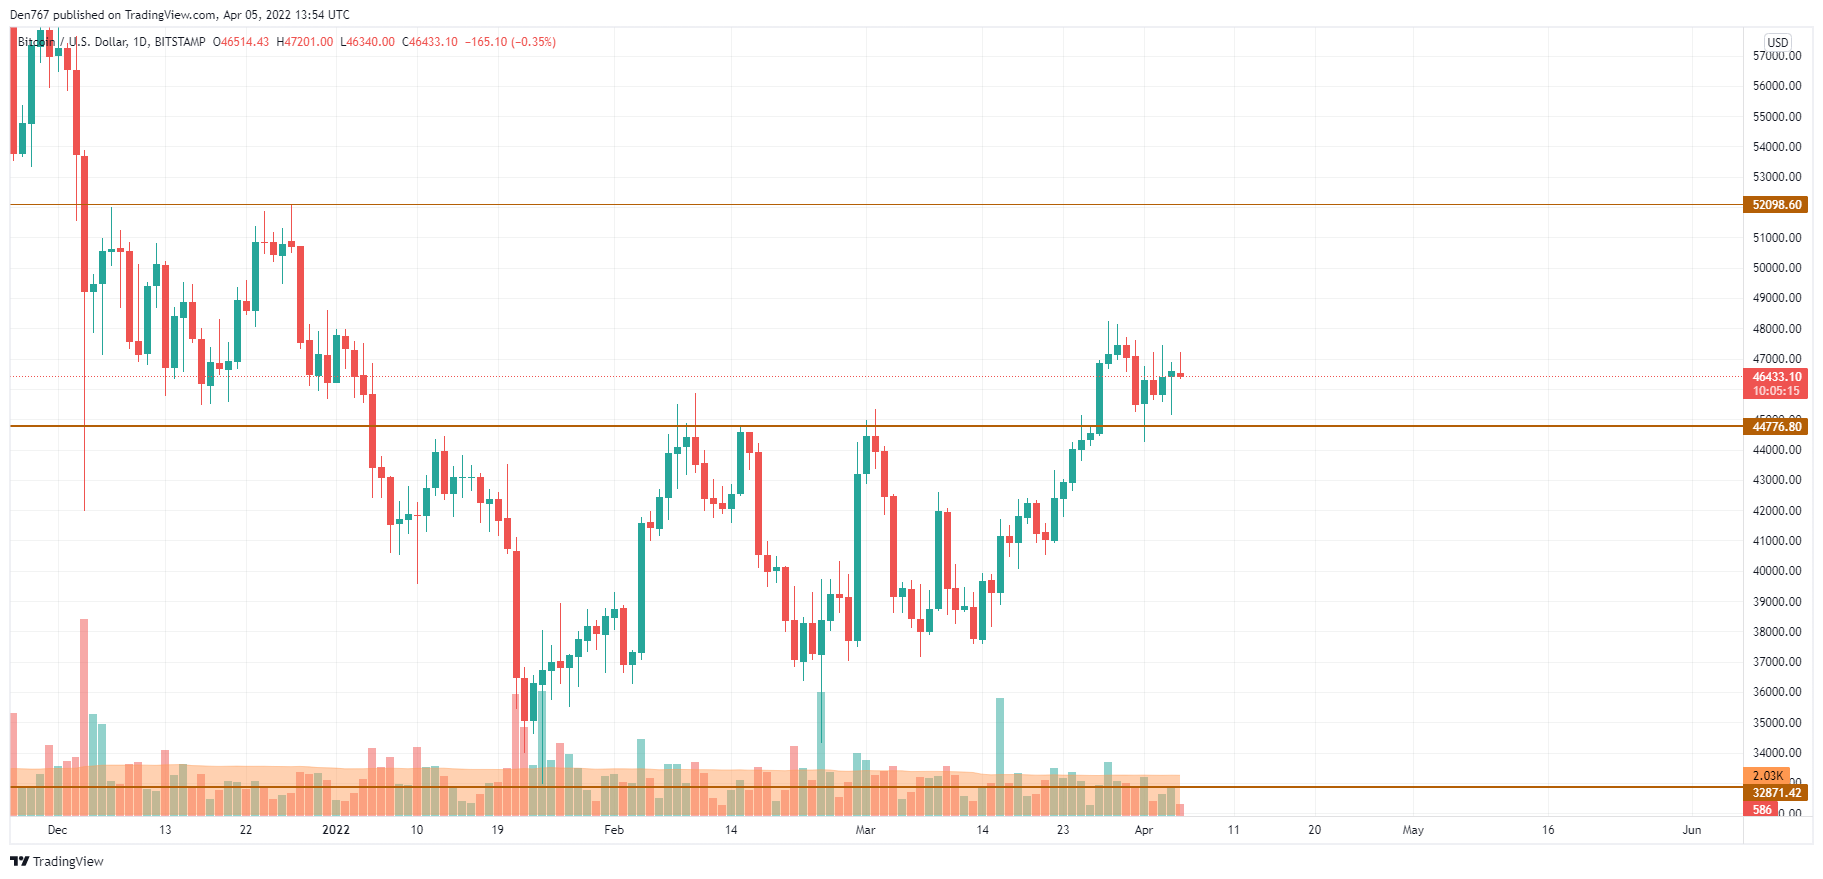
Despite the slight growth, Bitcoin (BTC) could not overcome the $47,000 mark. In addition, the buying trading volume has declined, which means that the buyers are not ready to keep the rise from the current levels. In this case, there is a high chance to see the test of the $44,700 level again.
Bitcoin is trading at $45,888 at press time.
ADA/USD
Cardano (ADA) has also gone down, falling by 3.70% since yesterday.
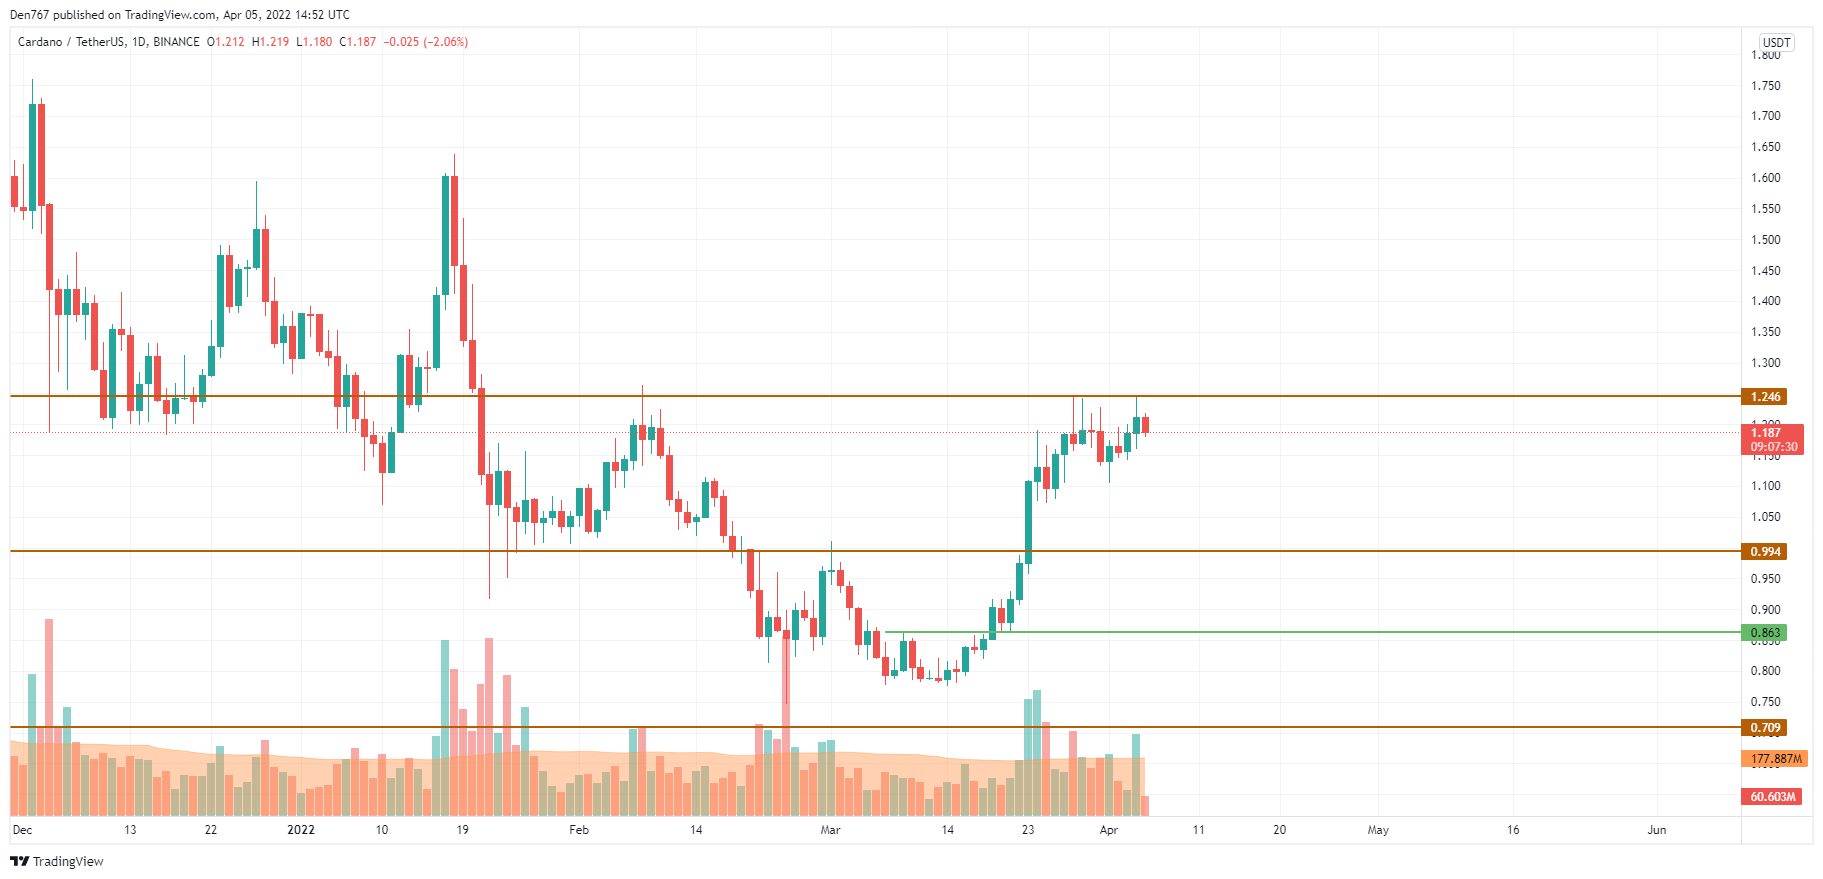
Cardano (ADA) is going down after a failed attempt to fix above the resistance at $1.246. Currently, bears are more powerful than bulls, which means that the ongoing drop may continue to the zone around $1.150. If sellers break this mark as well, one can expect a decrease to the psychological $1 level.
ADA is trading at $1.188 at press time.
BNB/USD
Binance Coin (BNB) is an exception to the rule, going up by 1.85% over the past 24 hours.
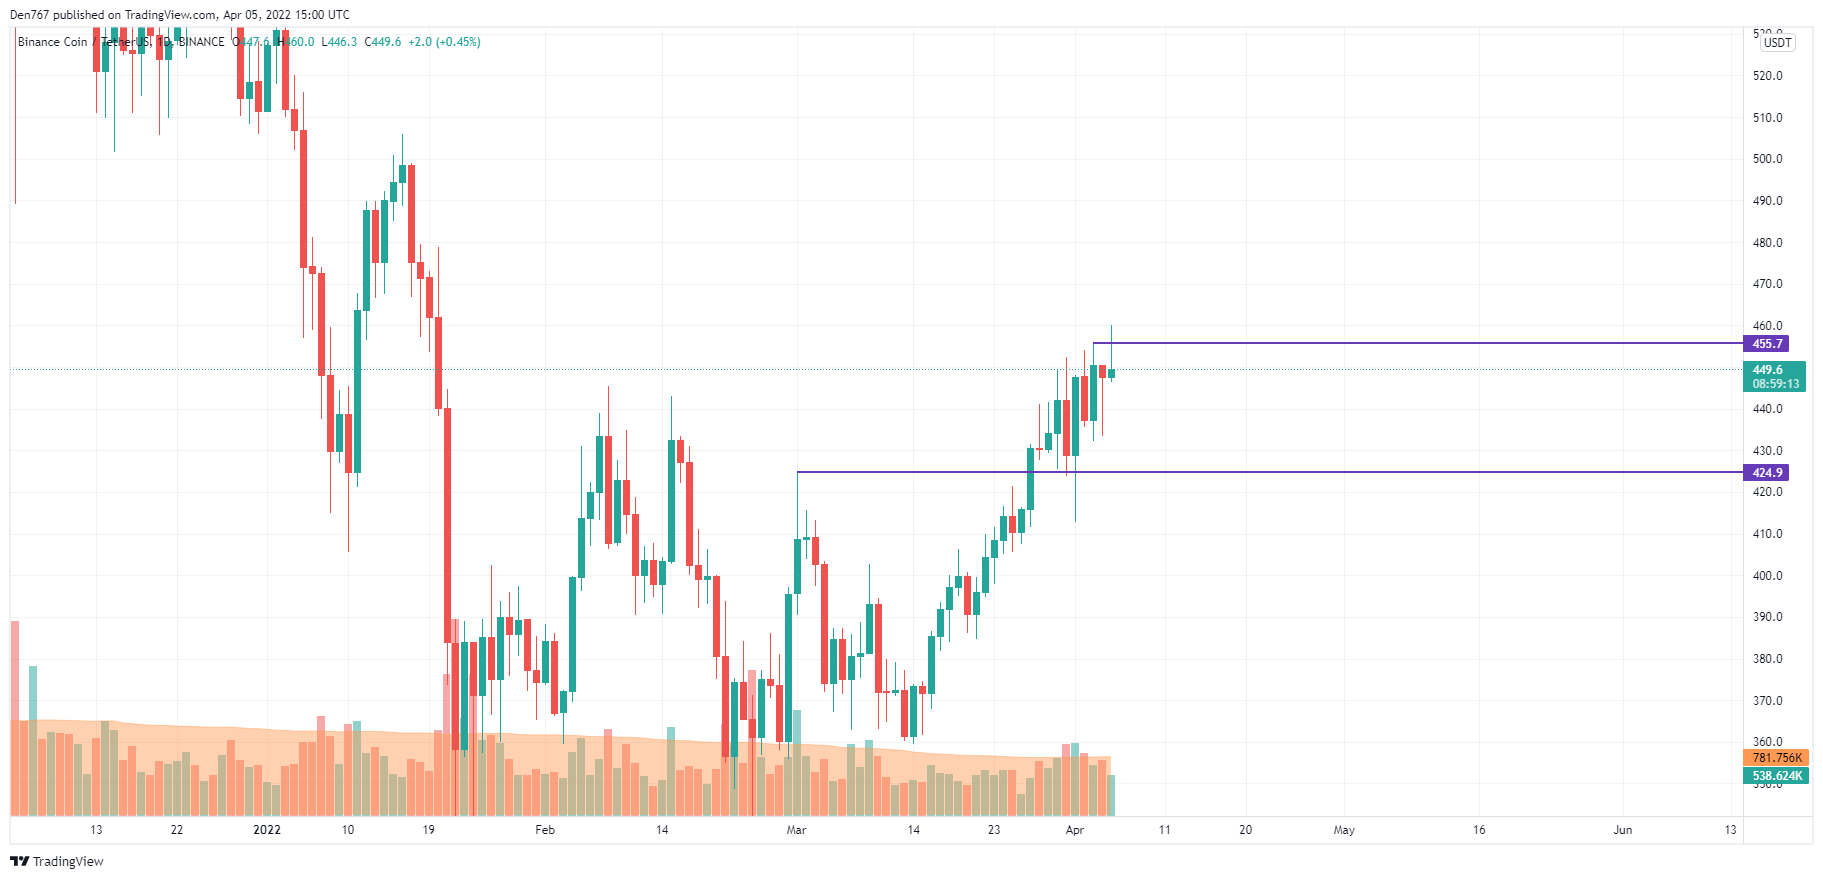
Binance Coin (BNB) has made a false breakout of the $455 mark. The rise has not been accompanied by a high trading volume, which means that buyers are weak and lack energy for further growth.
That is why the rollback to the $440 mark is the more likely scenario for the upcoming days.
BNB is trading at $450 at press time.
LUNA/USD
Unlike other coins, LUNA is the biggest gainer from the list today as the price of altcoin has rocketed by 5.33%.
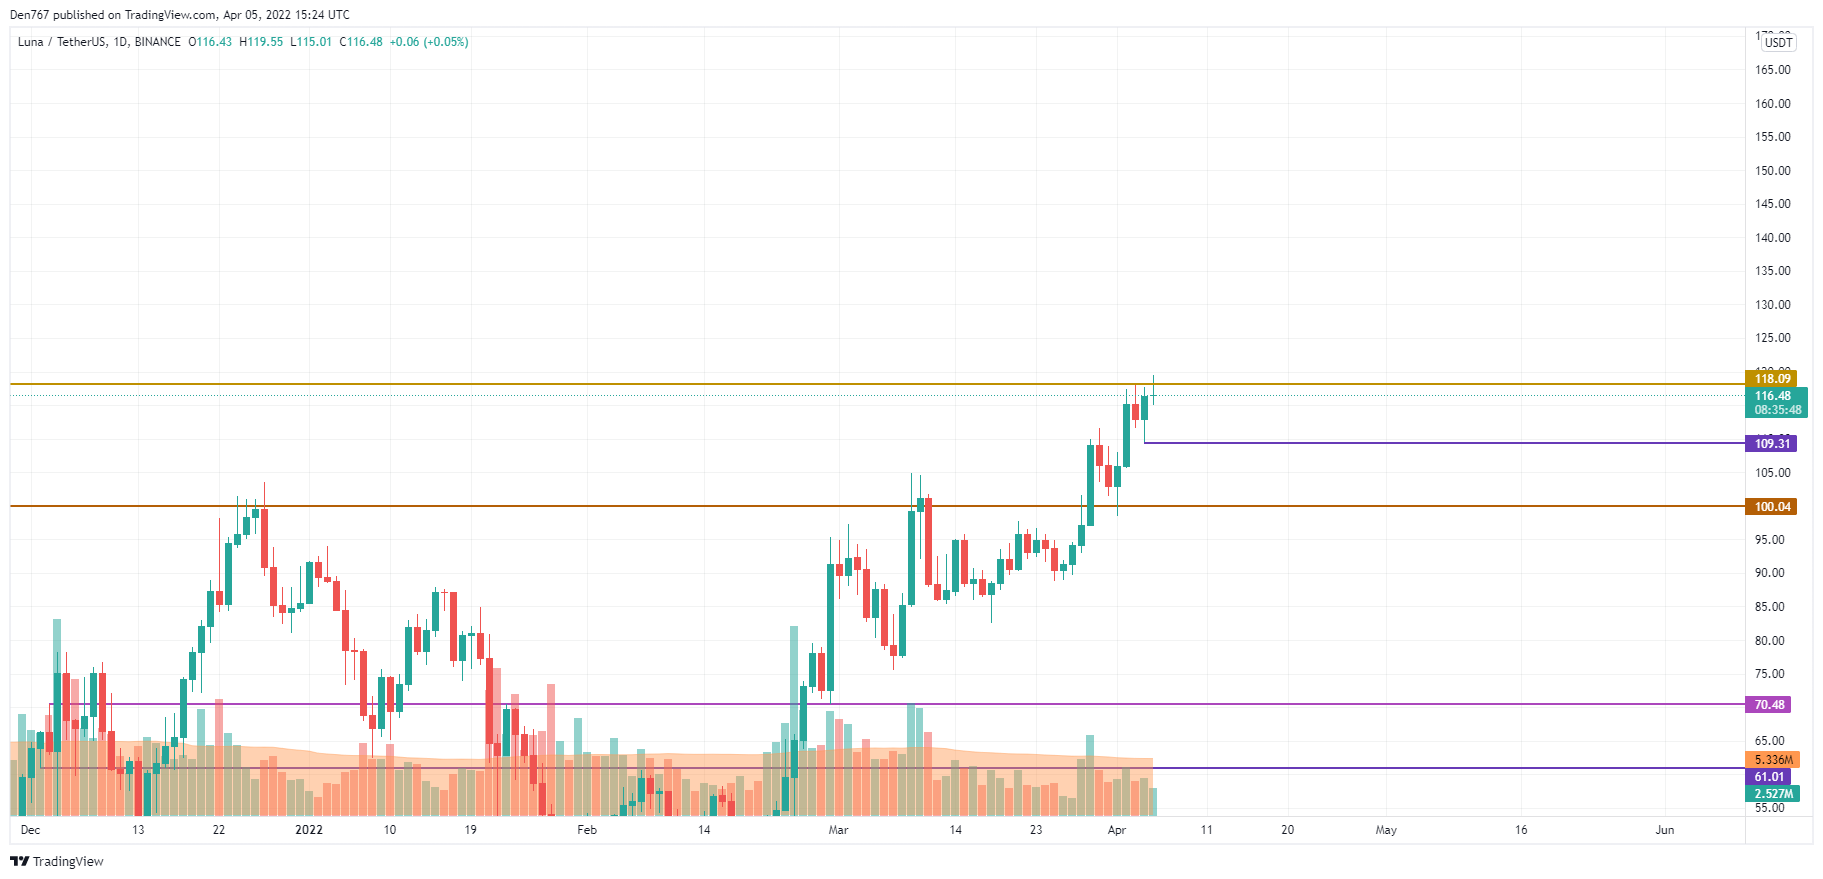
LUNA is trading similar to BNB as it could not set a new peak. The false breakout means that there is a chance to see the correction if the daily candle fixes below $118. In this regard, the fall may lead to the test of the local support at $109.31 shortly.
LUNA is trading at $116.44 at press time.
SOL/USD
The price of Solana (SOL) is also unchanged since yesterday. The growth has accounted for only 0.36% over the last day.
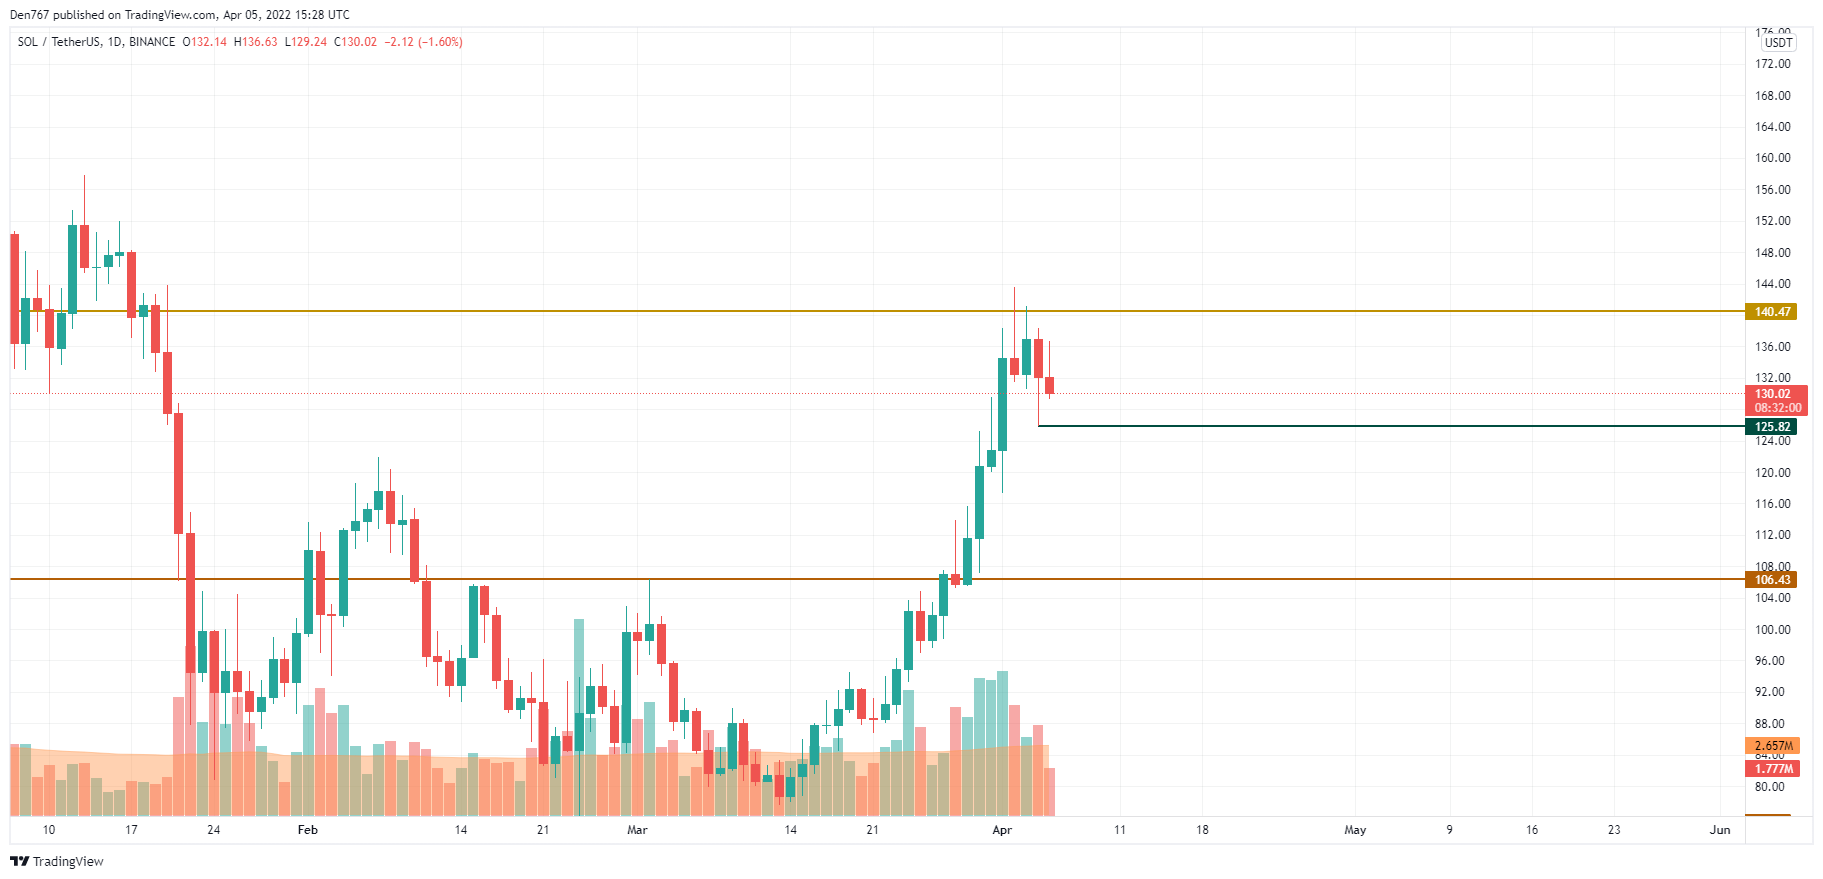
Solana (SOL) is going down after the test of the $140 mark. At the moment, the price is on the way to yesterday’s low at $125.82. If bulls break it, the decline may continue up to the area around $120 by the end of the week.
SOL is trading at $130.24 at press time.

