Bitcoin has shed close to 20% of its market value over the last week. King coin underwent six consecutive weeks of bearish pressure. The coin has retested levels that it touched in August, last year.
Price had tried to briefly recover as BTC tried pushing the $32,000 price level over the last 48 hours. Ever since Bitcoin breached the $37,000 level, it has been a free fall for the asset. Bitcoin’s all-time high was $68,000 which it secured in November 2021.
The $37,000 price mark had acted as a support level for multiple months. The continued long liquidation spree has made Bitcoin revisit the $30,000 price mark.
An upside seems unlikely considering sellers have taken hold of the market at the time of writing. Continued downslide will cause BTC to tumble below $30,000.
Bitcoin Price Analysis: One Hour Chart
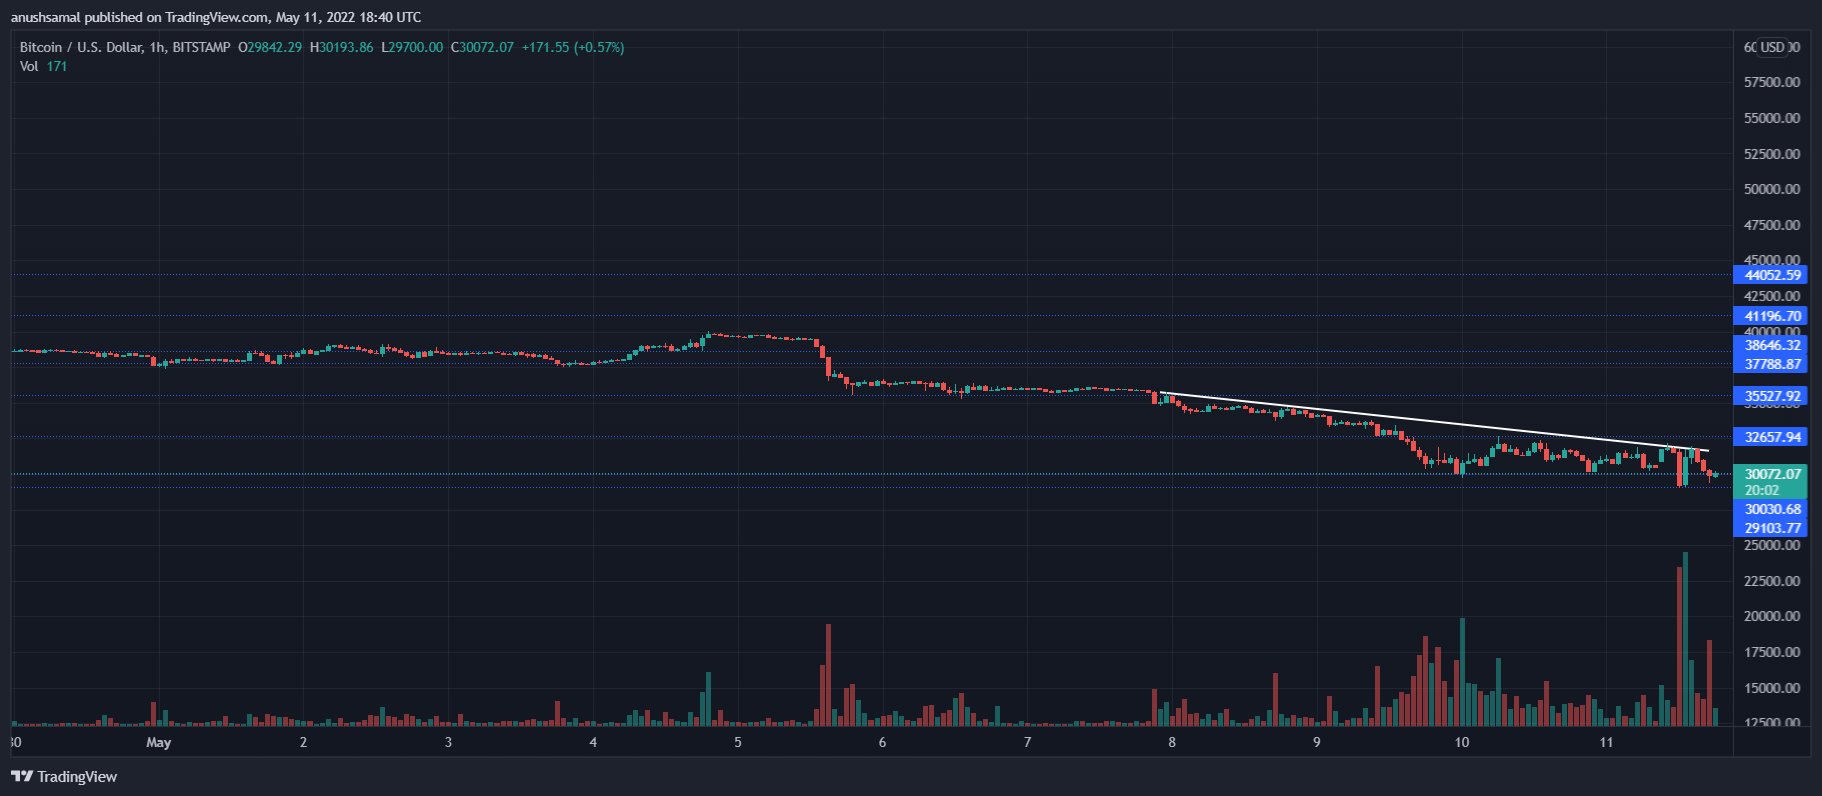
Bitcoin was seen trading at $30,100 at the time of writing. The $30,000 price level has been acting as a strong support level for the coin, however, prices can break below the same with continuous selling pressure.
The above support level is also acting as a strong demand zone for the coin and if buyers find their way back, BTC might propel to touch the $37,000 mark again. Panic selling can push BTC to trade near the $22,000 price level.
The fear index of the market continues to remain high amid the major sell-off noticed across the industry.

Bitcoin displays downward momentum (white) on the one hour time frame, this reading affirms the consistent bearish action action. Volume of Bitcoin traded was seen in green, this could highlight that price of the asset might be trying to present a comeback, however it is unlikely, as BTC trades close to the major support area.
Technical Analysis

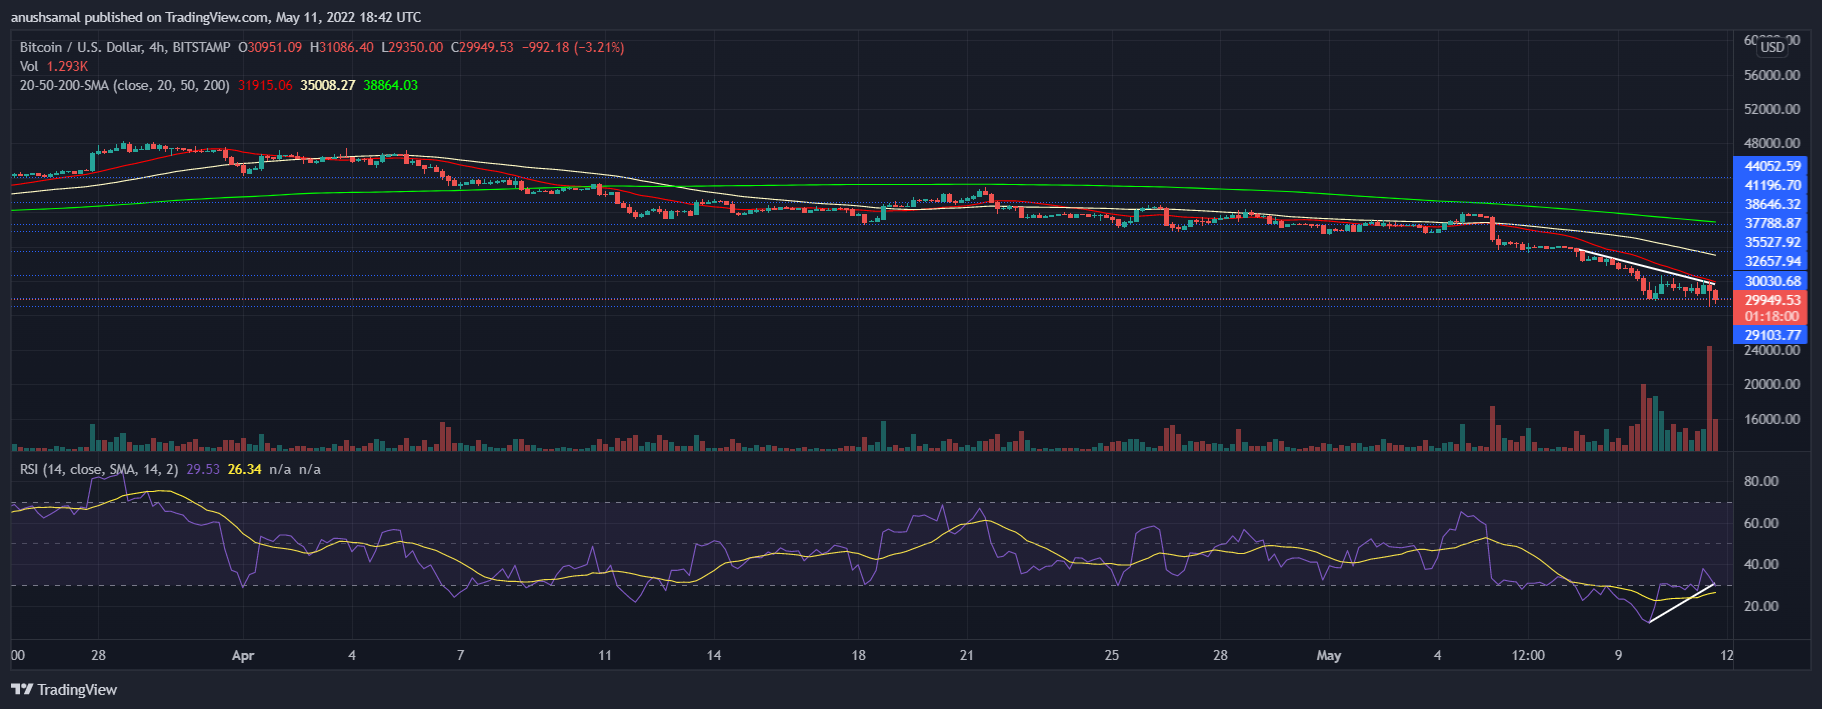
Bitcoin was trading beneath the 20-SMA line, this indicates that sellers were still active in the market. Price momentum was being driven by sellers in the market. At the time of writing, BTC was bordering oversold territories. Push from buyers would help BTC to trade above the 20-SMA line.
Interestingly, the Relative Strength Index had something else to say. Price of BTC has caused an influx of selling pressure, however, the chart displayed bullish divergence (white). Bullish divergence on the RSI could mean that BTC can climb north, however, chances are quite slim.
Related Reading | TA: Bitcoin Struggles Below $32K, Why Downtrend Could Resume

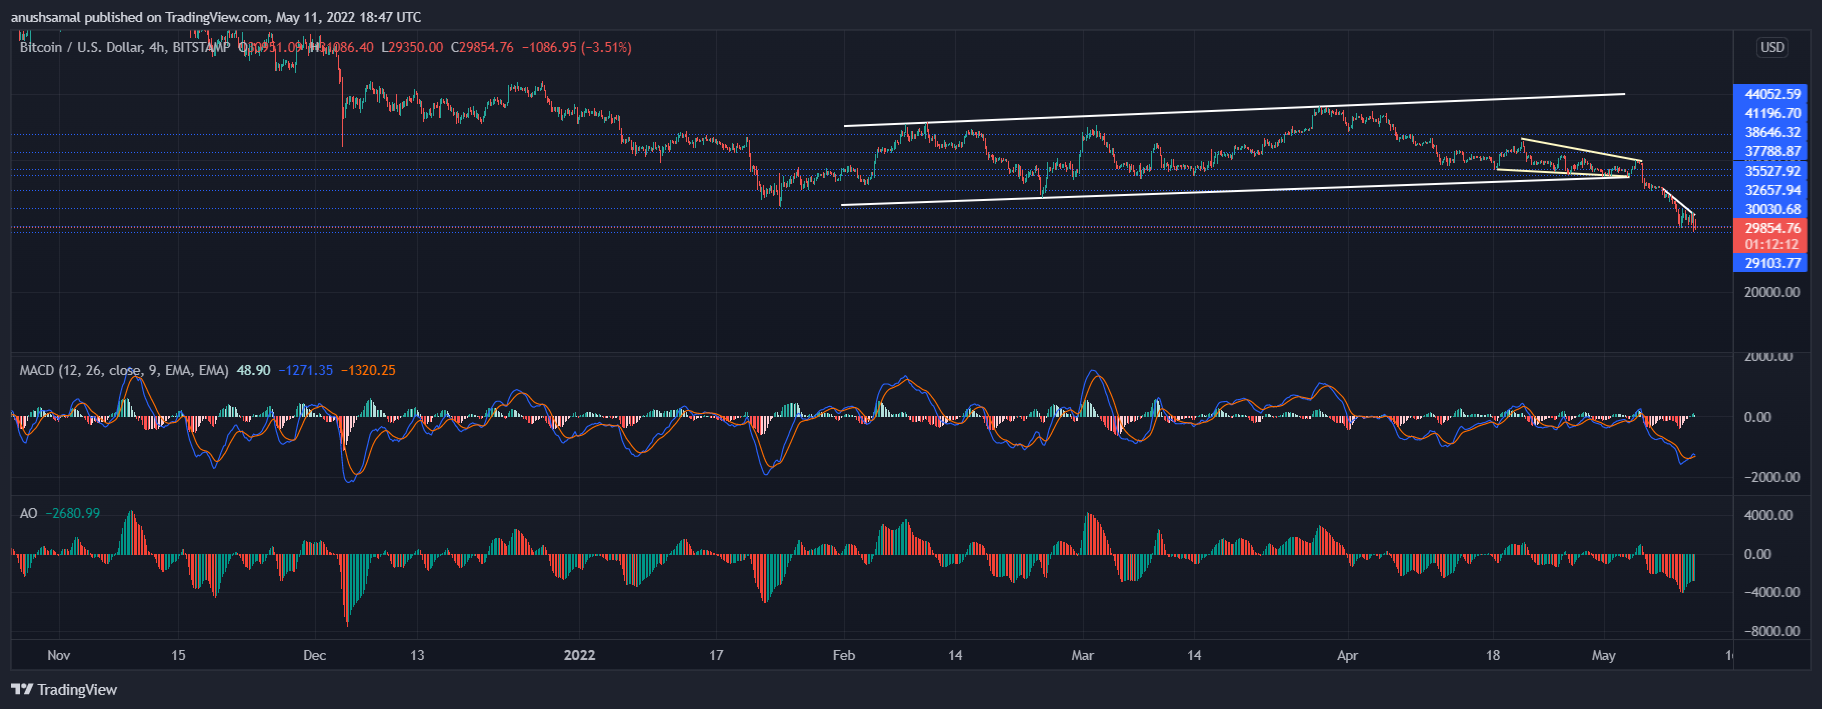
Bitcoin had been forming a bearish flag over the past couple of months. This was a signal that BTC was about to go on a downward price action. Despite forming a falling wedge pattern (yellow), which is considered bullish, a break from within the same caused price of BTC to tumble further. Chances of rebound cannot be ruled out but the bearish pressure seems too intense at the moment.
Moving Average Convergence Divergence (MACD) indicates the price momentum and it continues to paint a bearish pressure. Confirming the same, Awesome Oscillator also depicted minimised green signal bars under the zero-line, highlighting negative price movement on charts.
Related Reading | TA: Bitcoin Dives To $30K, Why Short-term Recovery Seems Possible
Featured image from UnSplash, Charts from TradingView.com

