Analyst William Clemente published interesting chart with quarterly Bitcoin (BTC) candles; it looks like BTC demonstrates a new pattern in 2021-2022
Contents
Bitcoin (BTC) supporters on Twitter are guessing at what a new pattern means and how it could affect Bitcoin (BTC) price dynamics in 2022.
“Sideways for a year”: Bitcoin (BTC) prints Doji candles on quarterly chart
Mr. Clemente, lead insights analyst at Blockware and popular crypto podcaster, has taken to Twitter to share the chart that displays Bitcoin (BTC) performance quarter by quarter on a logarithmic scale.
With Q1 in the books, here is a historical view of Bitcoin’s quarterly candles pic.twitter.com/GoV5Pu01xw
— Will Clemente (@WClementeIII) April 1, 2022
It looks like Bitcoin (BTC) printed two ultra-thin candlesticks in a row, a situation unseen in its history. Thus, the period from Q4, 2021, to Q1, 2022, may be less volatile for Bitcoin (BTC).
Mr. Clemente’s Twitter followers shared various interpretations of this pattern that looks like what is called Doji Candlesticks among traders and analysts.
Some of them are certain that two thin candles are signaling massive consolidation, while other commentators indicate that this is a clear marker of Bitcoin’s maturation as an asset.
Does Bitcoin (BTC) love April?
Bitcoin (BTC) closed Q1 2022, down 1.46% compared to Jan. 1. This is the smallest negative Bitcoin (BTC) quarterly price movement in its history.
In Q4, 2021, the orange coin added 5.45%, which is the second least significant positive quarter for Bitcoin (BTC): in Q3, 2018, the crypto king gained 3.61% in 90 days.
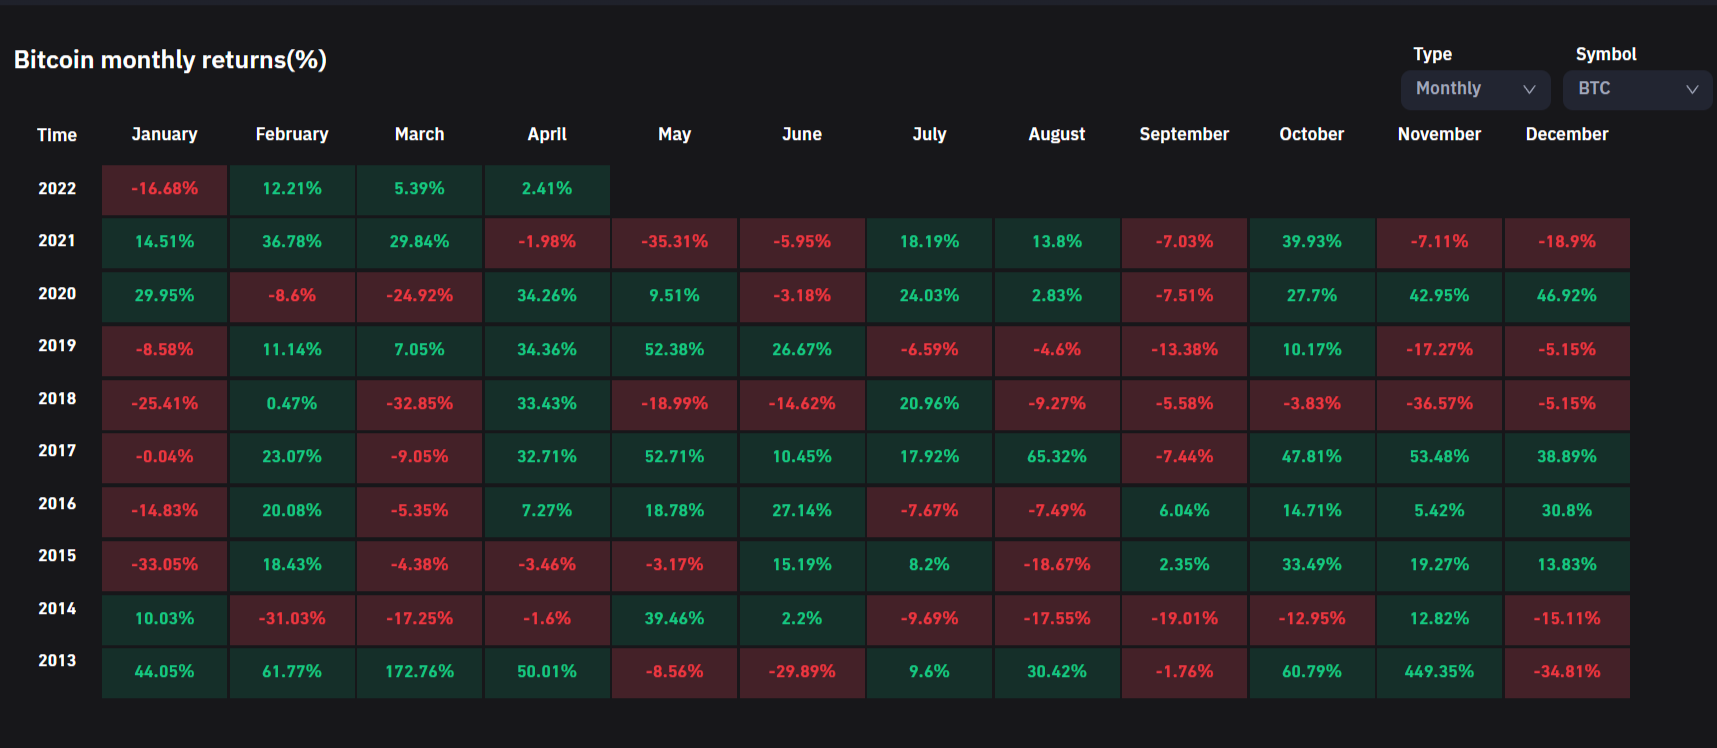
Typically, April is a green month for a first cryptocurrency. It closed April in the red only three times in 10 years with 1.6-3.4% losses.

At the same time, for four years in a row, April was bringing 33-35% gains to the flagship cryptocurrency. Should this happen again, Bitcoin (BTC) might easily return to levels over $62,000.

